Sevelamer Carbonate Tablet, Film Coated
Product Images NDC 33342-215

View Photos of Packaging, Regulatory Labels, and Product Appearance

Product Visual Gallery

This gallery contains 5 technical images submitted to the FDA as part of the official labeling for Sevelamer Carbonate (NDC 33342-215). Unlike standard consumer photos, these assets often include clinical data figures, molecular chemical structures, and official manufacturer packaging layouts.

As provided by Macleods Pharmaceuticals Limited, these visuals offer a comprehensive scientific overview of the product's physical and chemical identity, aiding pharmacists and researchers in product verification and study.

FDA Label Image

505 (Sevelamer Carbonate Container 270s)
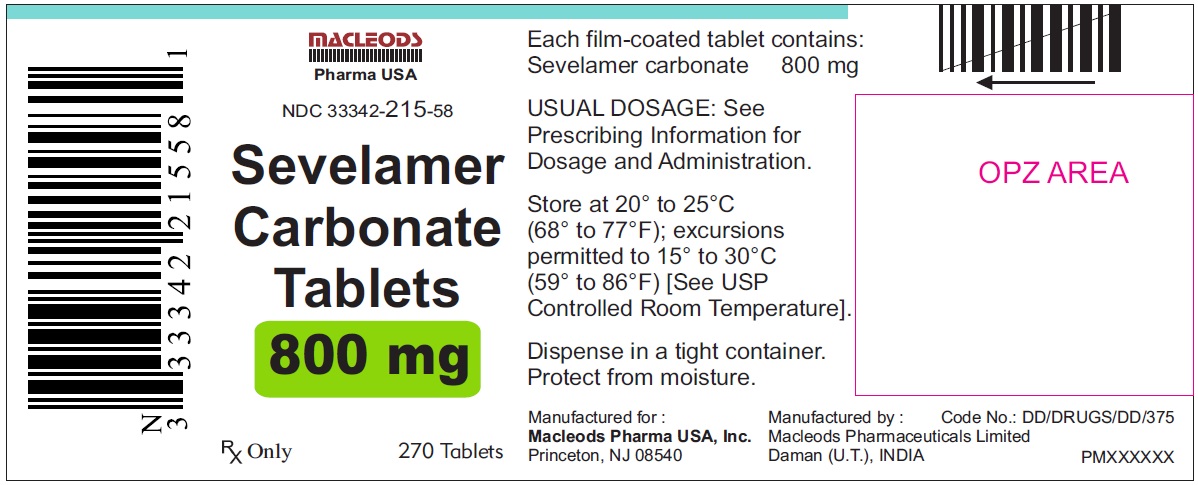
505 (Sevelamer Carbonate Container 270s)
Label for Sevelamer Carbonate 800 mg film-coated tablets, oral use. The label indicates 270 tablets per container and is manufactured by Macleods Pharmaceuticals Limited, with distribution by Macleods Pharma USA, Inc. Storage instructions and a dosage note referencing prescribing information are also included.*
FDA Label Image

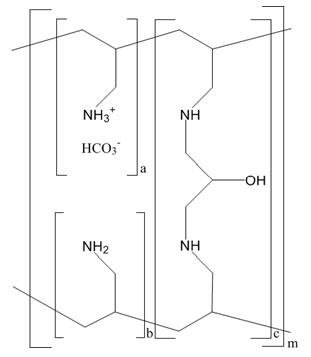
Sevelamer-car-structure (Sevelamer Carbonate Fig 1)

Sevelamer-car-structure (Sevelamer Carbonate Fig 1)
Chemical structure of the active ingredient Sevelamer Carbonate, depicting its polymeric composition with ammonium and bicarbonate ions.*
FDA Label Image

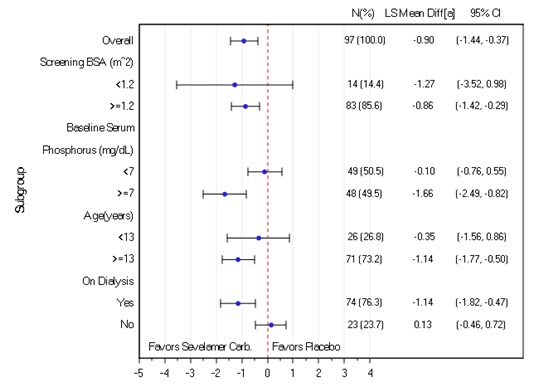
Figure-2 (Sevelamer Carbonate Fig 2)

Figure-2 (Sevelamer Carbonate Fig 2)
A forest plot depicting subgroup analyses comparing Sevelamer Carbonate with placebo. The y-axis lists subgroups such as Screening BSA, Baseline Serum Phosphorus, Age, and Dialysis status. The x-axis represents the mean difference favoring either Sevelamer Carbonate or placebo. Data points with confidence intervals show effect sizes across these subgroups.*
FDA Label Image

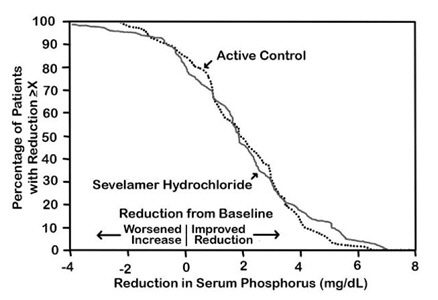
Figure-3 (Sevelamer Carbonate Fig 3)

Figure-3 (Sevelamer Carbonate Fig 3)
A line graph showing the percentage of patients with a 2-fold reduction in serum phosphorus plotted against the reduction in serum phosphorus levels (mg/dL). It compares Sevelamer Hydrochloride to an active control, illustrating changes from baseline with axes labeled for percentage of patients and reduction in serum phosphorus.*
FDA Label Image

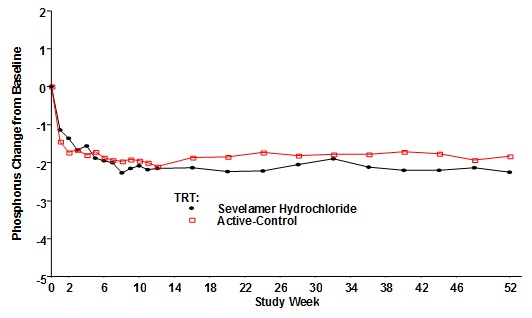
Figure-4 (Sevelamer Carbonate Fig 4)

Figure-4 (Sevelamer Carbonate Fig 4)
A line graph depicting phosphorus change from baseline over a 52-week study period. Two treatment groups, Sevelamer Hydrochloride and Active-Control, are compared, showing phosphorus levels on the y-axis and study weeks on the x-axis. The graph illustrates the trend and variations in phosphorus levels for both groups during the study.*

* About these descriptions: Image descriptions on this page are generated by automated AI analysis of the product label images from the manufacturer's FDA label submission (SPL). They are provided for reference only and may contain errors or omissions. Always rely on the printed label itself and the official FDA labeling, and consult a pharmacist or healthcare professional with any questions about this product.