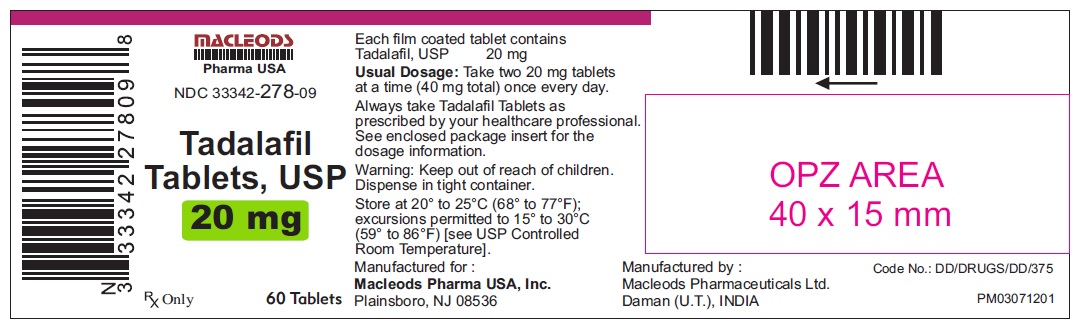
Product Images Tadalafil

View Photos of Packaging, Labels & Appearance

Product Label Images

The following 9 images provide visual information about the product associated with Tadalafil NDC 33342-278 by Macleods Pharmaceuticals Limited, such as packaging, labeling, and the appearance of the drug itself. This resource could be helpful for medical professionals, pharmacists, and patients seeking to verify medication information and ensure they have the correct product.

tadalafil-20mg-30-container - tadalafil 20mg 30 bottle

tadalafil-20mg-30-container - tadalafil 20mg 30 bottle

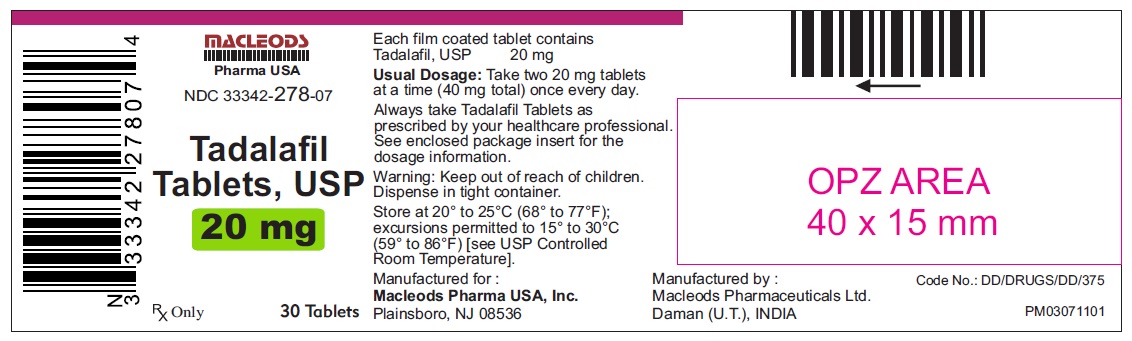
Tadalafil tablets containing 20mg of Tadalafil USP. The recommended dosage is to take two tablets at a time (40mg total) once every day as prescribed by your healthcare professional. Store in a tight container at 20° to 25°C (68° to 77°F), with permitted excursions to 15° to 30°C (59° to 86°F) [see USP Controlled Room Temperature]. This medication is manufactured for Macleods Pharma USA, Inc. and manufactured by Macleods Pharmaceuticals Ltd. in Daman (U.T.), India. Always refer to the enclosed package insert for dosage information. Warning: Keep out of reach of children. *
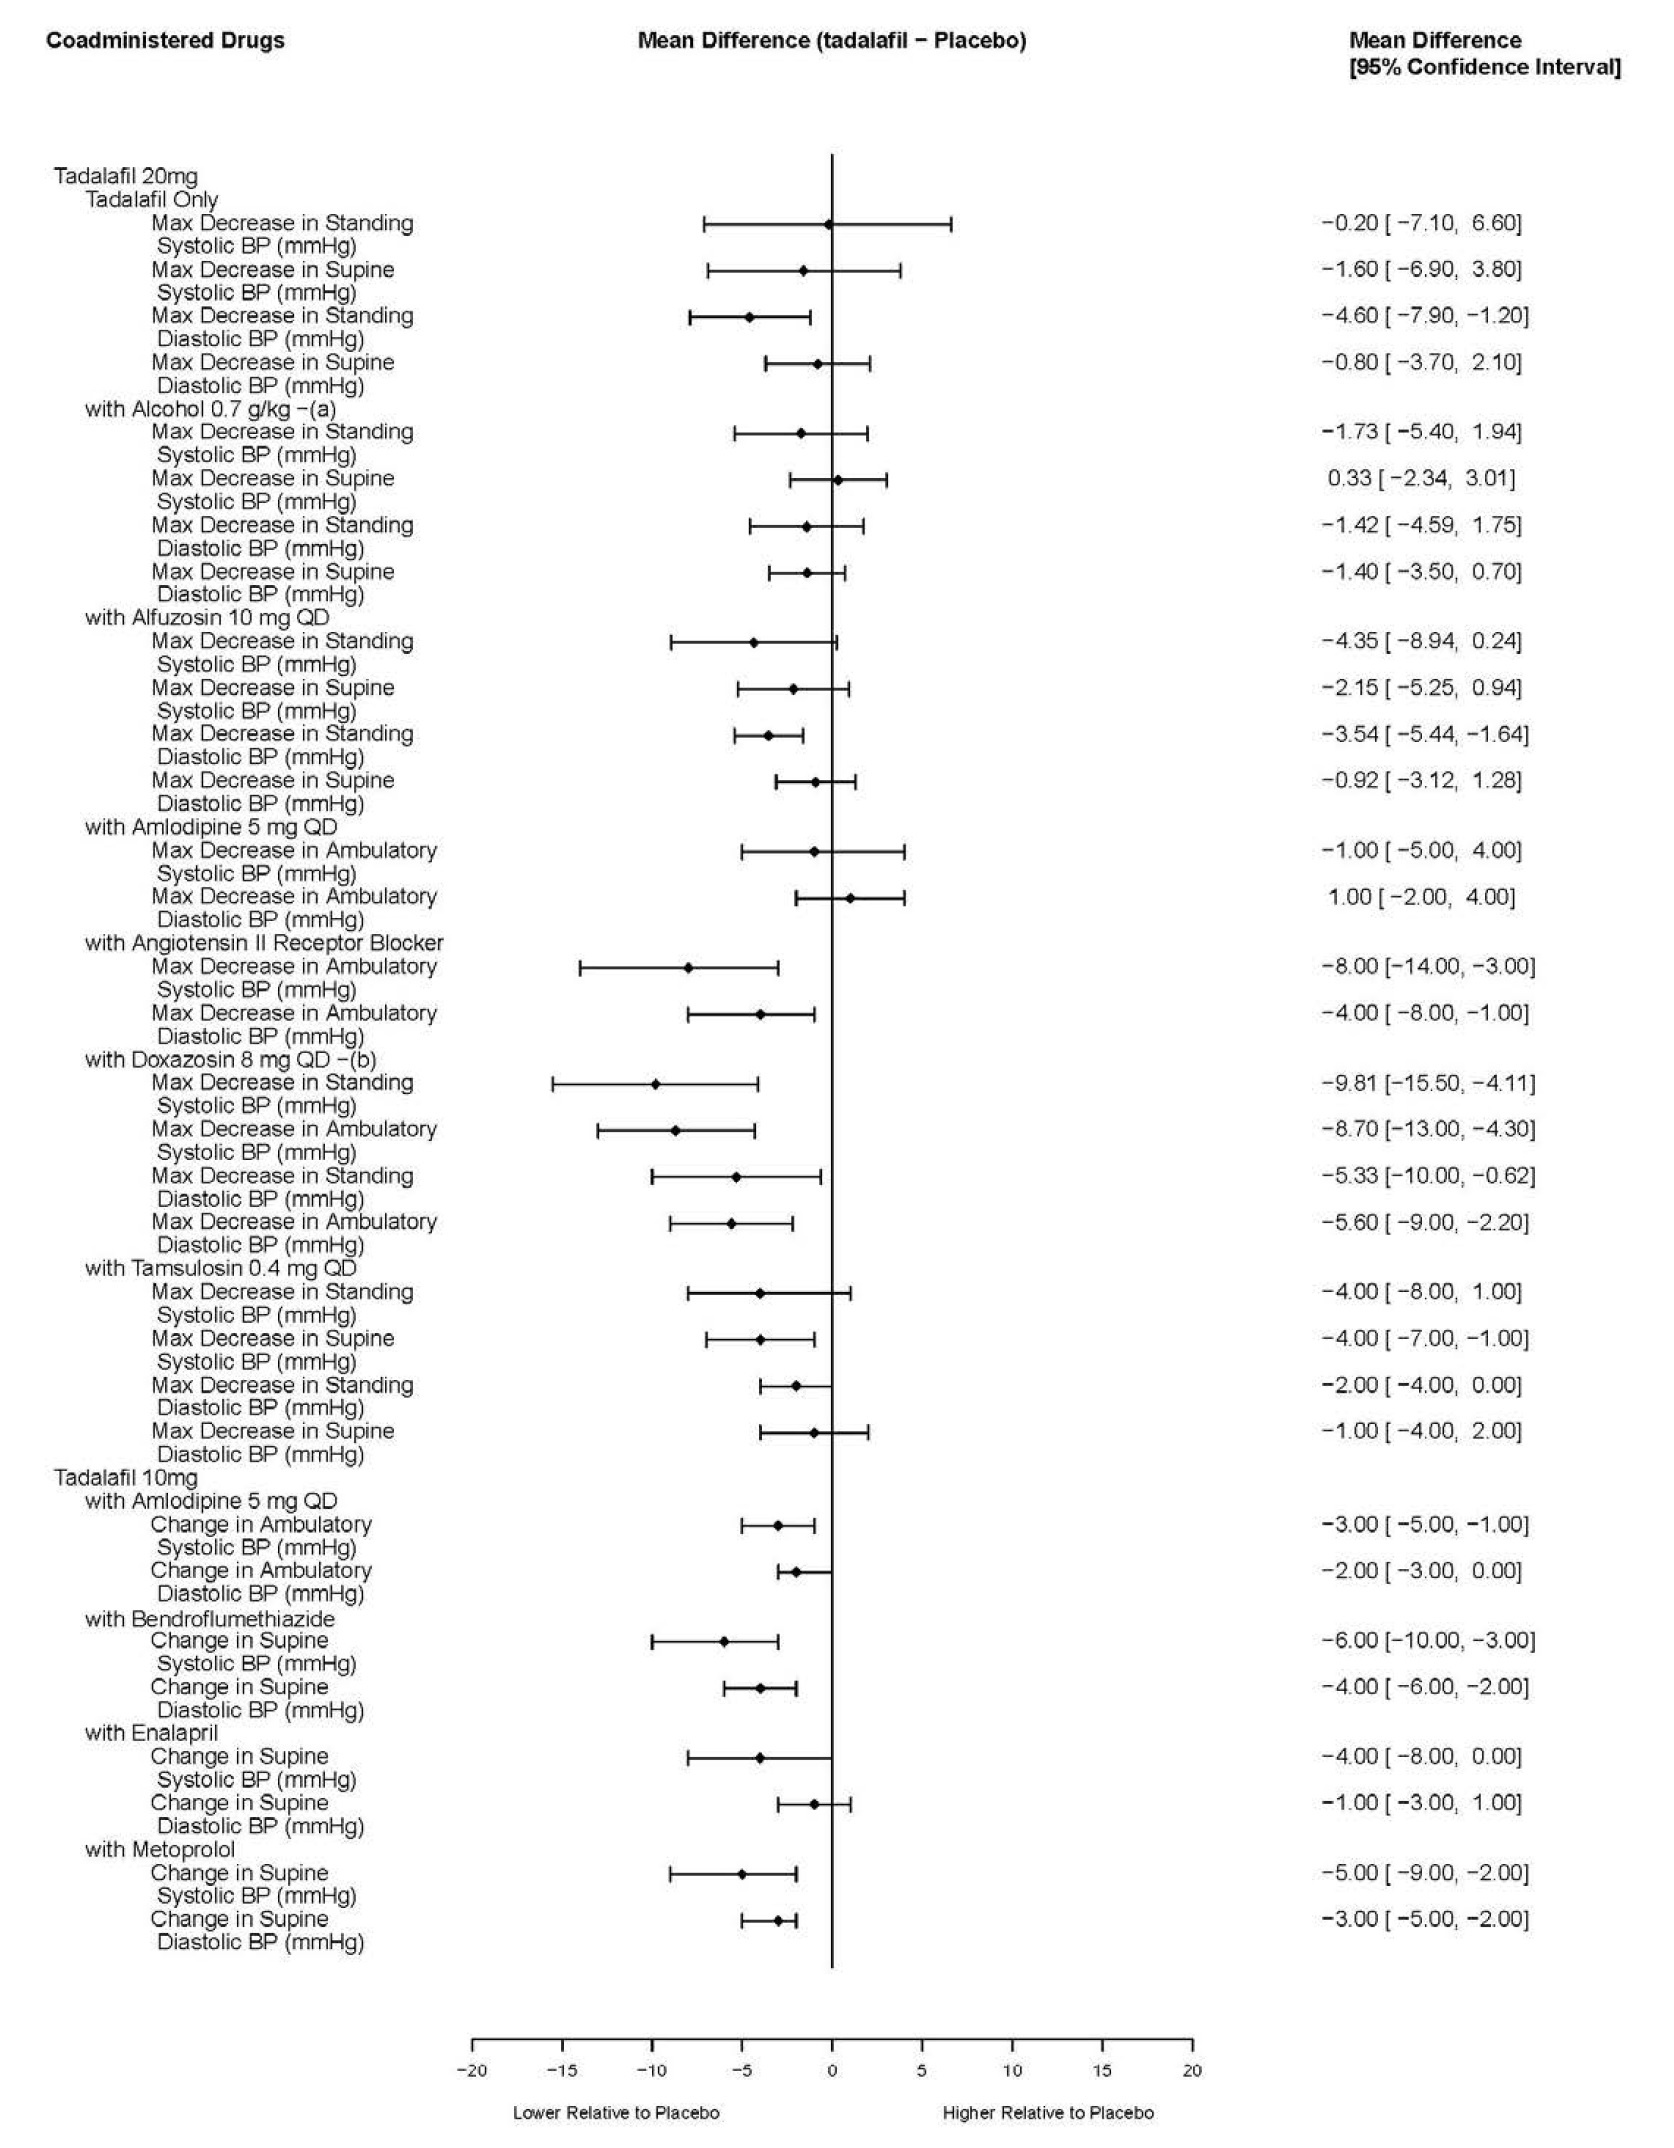
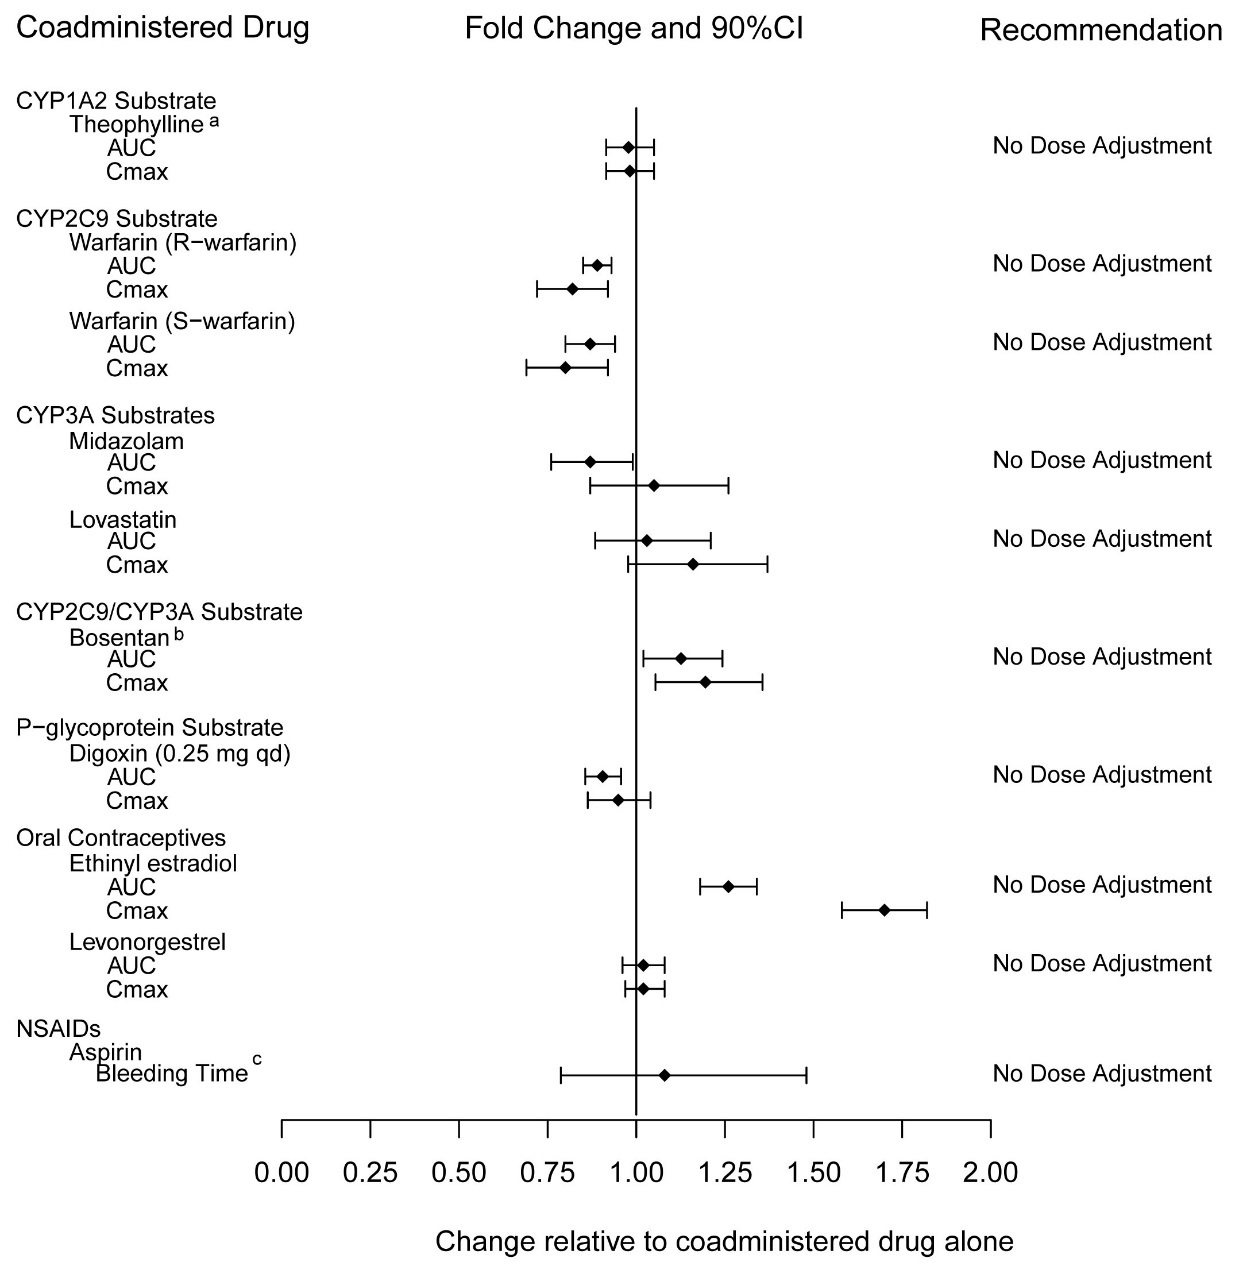
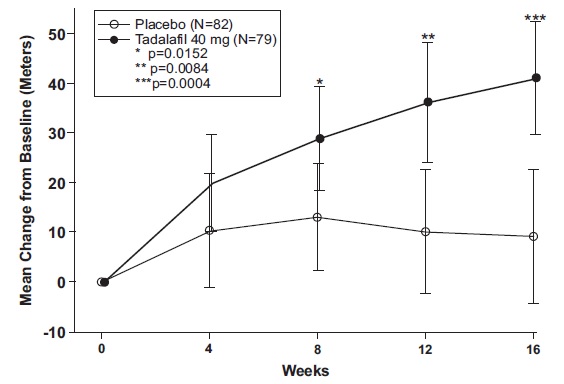
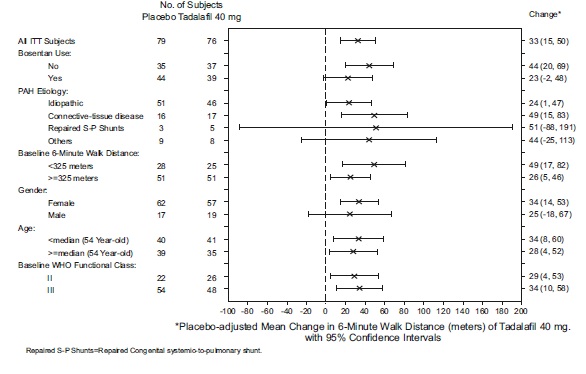
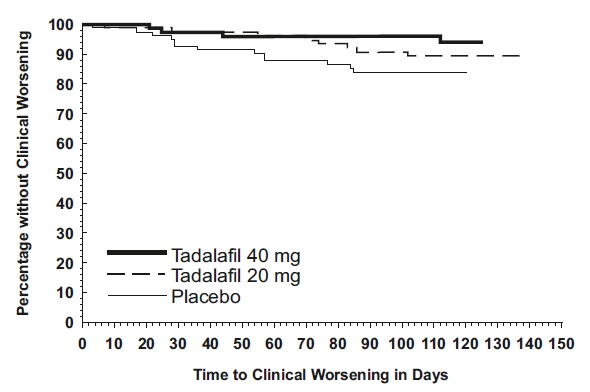
tadalafil-20mg-60-container - tadalafil 20mg 60 bottle

tadalafil-20mg-60-container - tadalafil 20mg 60 bottle

This is a description of Tadalafil tablets manufactured by Macleods Pharma USA, Inc. The usual dosage is two 20 mg tablets taken at a time (40 mg total) once every day. The tablets come in a package with an enclosed package insert. The tablets should be kept out of reach of children and stored at a temperature of 20° to 25°C (68° to 77°F). Each film-coated tablet contains Tadalafil, USP 20mg. The tablets are manufactured by Macleods Pharmaceuticals Ltd. in Daman (U.T.), INDIA.*

tadalafil fig1

tadalafil fig1

The text appears to be a table of data with numerical values for the effects of coadministered drugs with Tadalafil 20mg or Tadalafil 10mg on standing and supine systolic and diastolic blood pressure, presented as max decreases, mean difference, and confidence intervals. It also includes changes in ambulatory systolic and diastolic blood pressure. There is no available context or purpose for the data presented.*

tadalafil fig2

tadalafil fig2

This document appears to be a chart or table showing how the coadministration of various drugs affects the pharmacokinetics of tadalafil. The chart provides information on drugs that inhibit or induce the CYP3A enzyme as well as antacids and H2 antagonists. The chart displays data on the drugs' effects on tadalafil's AUC and Cmax, as well as other statistical measurements such as fold change and 90% Cll. The chart also provides recommendations on whether to adjust the dose of tadalafil when coadministered with each drug or to avoid using the drug altogether.*

tadalafil fig3

tadalafil fig3

This is a table showing the effect of a coadministered drug on various substrates metabolized by different enzymes like CYP1A2, CYP2C9, CYP3A, and P-glycoprotein. The substrates include drugs like Warfarin, Midazolam, Lovastatin, and Digoxin among others. The table also provides recommendations for fold change and 90% Cl which can be used to determine whether dose adjustment is needed or not.*

tadalafil fig5

tadalafil fig5

The text describes a chart showing the mean change from baseline in meters for a placebo group and a group taking tadalafil 40 mg. The tadalafil group showed significant improvement compared to the placebo group, with a p-value of 0.0004. The chart shows a gradual increase in mean change from baseline for both groups, with the tadalafil group consistently performing better.*

figure2 - tadalafil figure2

figure2 - tadalafil figure2

figure3 - tadalafil figure3

figure3 - tadalafil figure3

The text seems to be a graph representing the comparison of the time to clinical worsening in days between placebo, Tadalafil 20mg, and Tadalafil 40mg. The graph shows the percentage without clinical worsening over time. No further information or context is available.*

str - tadalafil str

str - tadalafil str

* The product label images have been analyzed using a combination of traditional computing and machine learning techniques. It should be noted that the descriptions provided may not be entirely accurate as they are experimental in nature. Use the information in this page at your own discretion and risk.