Sevelamer Carbonate Powder, For Suspension
Product Images NDC 33342-288

View Photos of Packaging, Regulatory Labels, and Product Appearance

Product Visual Gallery

This gallery contains 6 technical images submitted to the FDA as part of the official labeling for Sevelamer Carbonate (NDC 33342-288). Unlike standard consumer photos, these assets often include clinical data figures, molecular chemical structures, and official manufacturer packaging layouts.

As provided by Macleods Pharmaceuticals Limited, these visuals offer a comprehensive scientific overview of the product's physical and chemical identity, aiding pharmacists and researchers in product verification and study.

FDA Label Image

666 (Sevelamer Carbonate Suspension 2 4g 90s Cont)
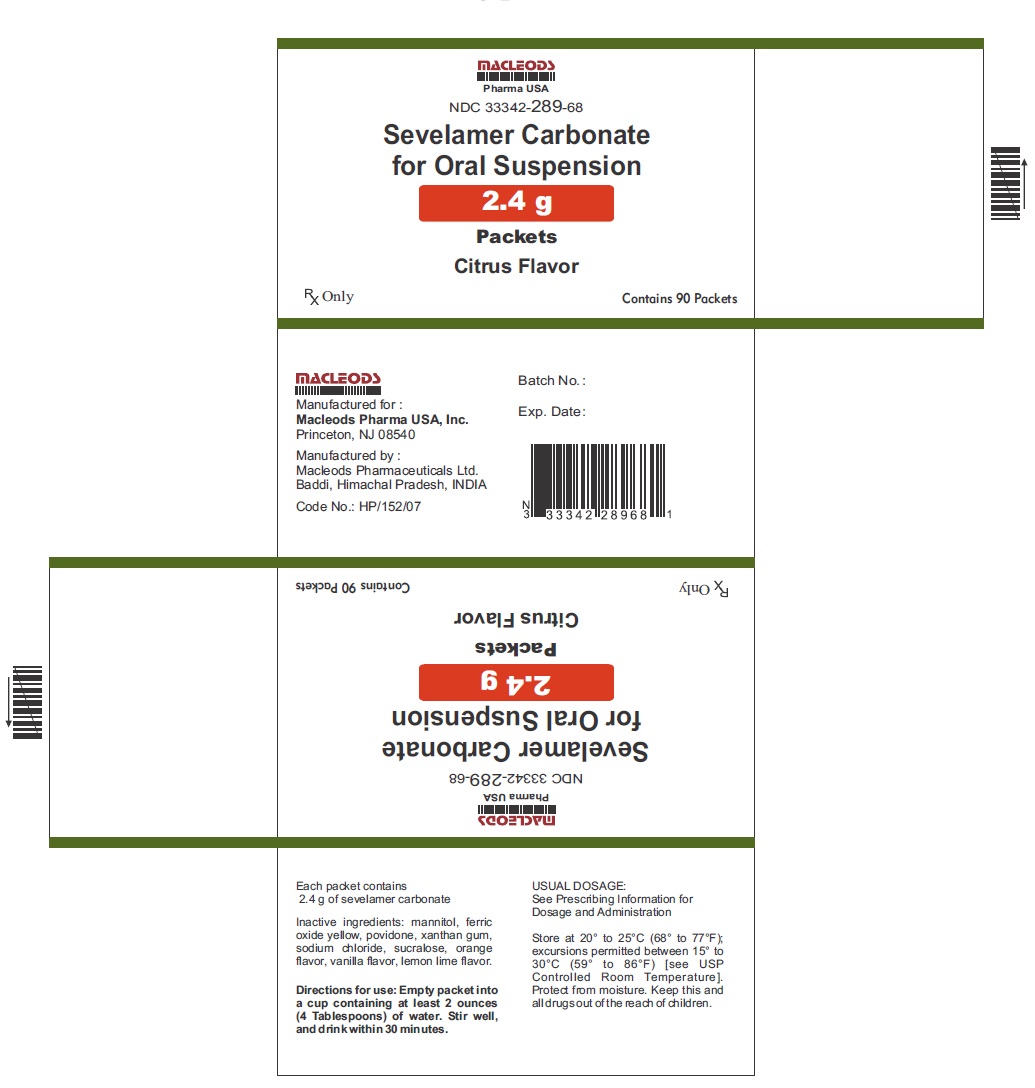
666 (Sevelamer Carbonate Suspension 2 4g 90s Cont)
Label for Sevelamer Carbonate 2.4 g packets for oral suspension, citrus flavor, manufactured by Macleods Pharmaceuticals Limited. The label states each packet contains 2.4 g of sevelamer carbonate and lists inactive ingredients. Directions for use instruct mixing with water and drinking within 30 minutes. The packaging contains 90 packets.*
FDA Label Image

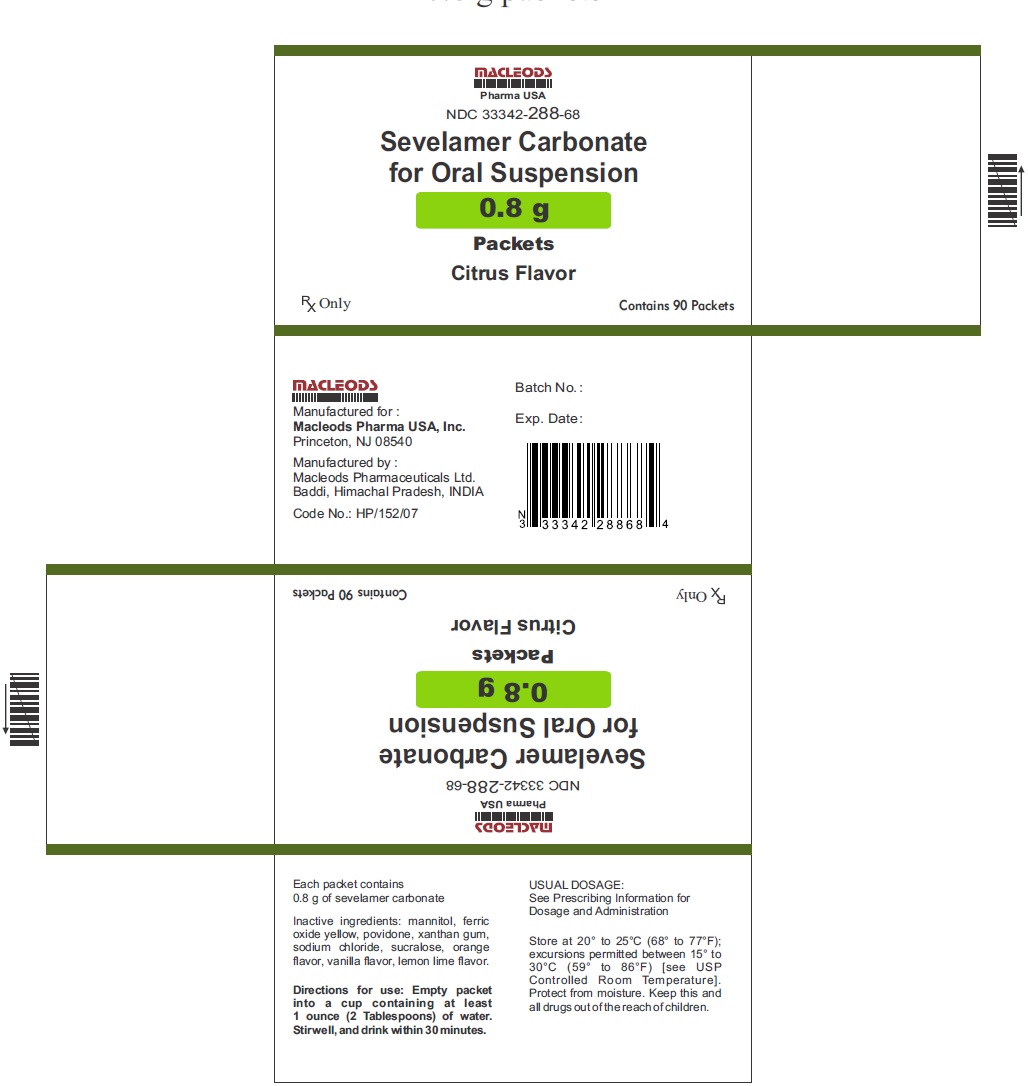
111 (Sevelamer Carbonate Suspension 8g 90s Cont)

111 (Sevelamer Carbonate Suspension 8g 90s Cont)
Label for Sevelamer Carbonate for Oral Suspension 0.8 g packets, citrus flavor, manufactured by Macleods Pharmaceuticals Limited. The label shows the dosage form as powder for suspension with 90 packets per container and includes storage instructions and inactive ingredients. It is labeled for prescription use only.*
FDA Label Image

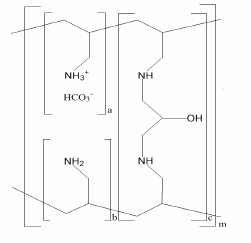
Str (Sevelamer Figure 1)

Str (Sevelamer Figure 1)
Chemical structure diagram of sevelamer carbonate, illustrating its polymeric backbone with amine groups and carbonate counterions, corresponding to the active ingredient sevelamer carbonate in the product.*
FDA Label Image

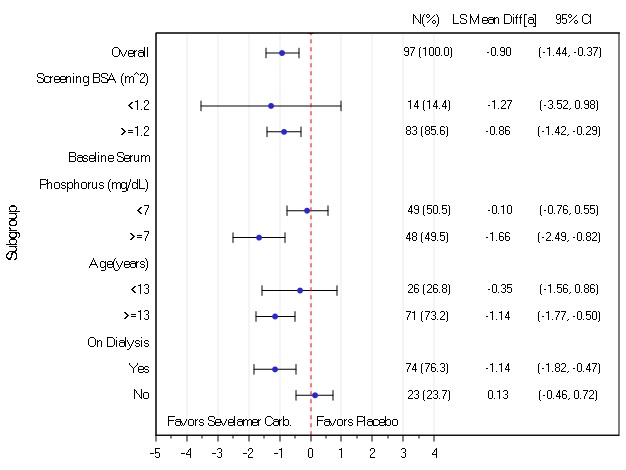
Fig-2 (Sevelamer Figure 2)

Fig-2 (Sevelamer Figure 2)
A forest plot chart illustrating subgroup analyses comparing Sevelamer Carbonate to placebo. It displays mean differences with 95% confidence intervals across subgroups by screening BSA, baseline serum phosphorus, age, and dialysis status, with markers indicating whether results favor Sevelamer Carbonate or placebo.*
FDA Label Image

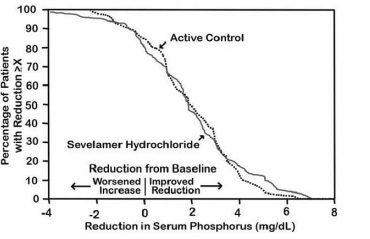
Fig-1 (Sevelamer Figure 3)

Fig-1 (Sevelamer Figure 3)
A line graph comparing the percentage of patients with phosphorus reduction for Sevelamer Hydrochloride against an active control. The x-axis represents the reduction in serum phosphorus (mg/dL) from baseline, ranging from -4 to 8, and the y-axis shows the percentage of patients with reduction, from 0 to 100%.*
FDA Label Image

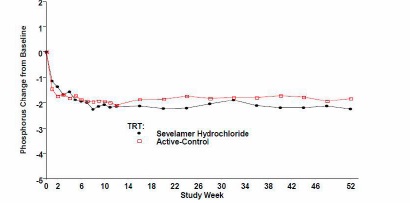
Fig-4 (Sevelamer Figure 4)

Fig-4 (Sevelamer Figure 4)
A line graph depicting phosphorus change from baseline over 52 study weeks, comparing Sevelamer Hydrochloride and Active-Control. The x-axis represents study weeks from 0 to 52, and the y-axis represents phosphorus change from baseline, ranging from -5 to 2. Both lines trend downward initially then stabilize.*

* About these descriptions: Image descriptions on this page are generated by automated AI analysis of the product label images from the manufacturer's FDA label submission (SPL). They are provided for reference only and may contain errors or omissions. Always rely on the printed label itself and the official FDA labeling, and consult a pharmacist or healthcare professional with any questions about this product.