Fig-1 (Colchicine Fig 1)
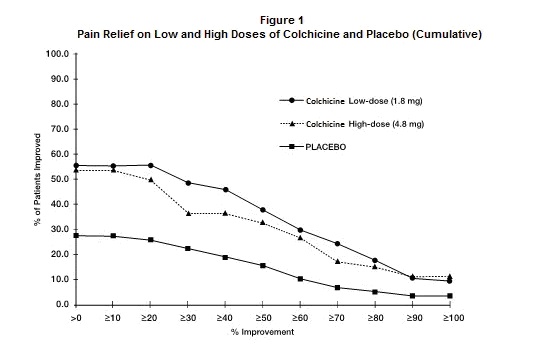
This text seems to provide data on pain relief from different doses of colchicine and placebo. The graph in Figure 1 illustrates the percentage of patients experiencing improvement in pain on low and high doses of colchicine as well as on placebo. It seems to analyze the cumulative effect of pain relief based on the different treatments.*