Ticagrelor Tablet, Film Coated
Product Images NDC 33342-431

View Photos of Packaging, Regulatory Labels, and Product Appearance

Product Visual Gallery

This gallery contains 21 technical images submitted to the FDA as part of the official labeling for Ticagrelor (NDC 33342-431). Unlike standard consumer photos, these assets often include clinical data figures, molecular chemical structures, and official manufacturer packaging layouts.

As provided by Macleods Pharmaceuticals Limited, these visuals offer a comprehensive scientific overview of the product's physical and chemical identity, aiding pharmacists and researchers in product verification and study.

FDA Label Image

Ticagrelor-figure-1.jpg (Ticagrelor Figure 1)

Ticagrelor-figure-1.jpg (Ticagrelor Figure 1)
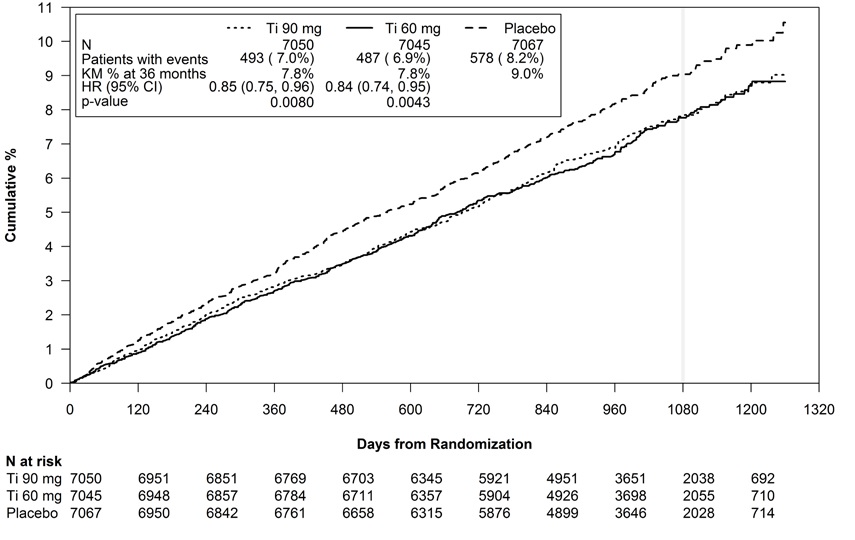
This is a comparison of two medications, Ta0mg and Clopidogrel, in terms of their effectiveness in reducing events in patients. The table shows the number of patients with events and the percentage at 12 months for both medications. Additionally, it provides the cumulative percentages over days from the first study drug dose. Ta0mg had 362 patients with events (3.9%) compared to 306 patients (3.3%) with Clopidogrel. The Kaplan-Meier percentage at 12 months was 45% for Ta0mg and 38% for Clopidogrel.*
FDA Label Image

Ticagrelor-figure-10.jpg (Ticagrelor Figure 10)

Ticagrelor-figure-10.jpg (Ticagrelor Figure 10)
This text appears to be a comparison of two treatments, Ti90mg and Clopidogrel, in patients with events. It includes the number of patients with events, Kaplan-Meier percentages at 12 months, hazard ratio (HR) with confidence interval, and p-value. The data also shows the number of days from randomization and the number of patients at risk for each treatment.*
FDA Label Image

Ticagrelor-figure-11.jpg (Ticagrelor Figure 11)

Ticagrelor-figure-11.jpg (Ticagrelor Figure 11)
This document provides detailed characteristics of a clinical trial, including demographic information, treatment approaches, medical history, and treatment outcomes comparing Ticagrelor and Clopidogrel. The information includes data on different subgroups such as geographic regions, planned treatment approaches, age groups, sex, race, and treatment effects in terms of hazard ratios. The results show the proportion of patients in each subgroup and how they responded to the treatments, along with hazard ratios and confidence intervals for each comparison.*
FDA Label Image

Ticagrelor-figure-12.jpg (Ticagrelor Figure 12)

Ticagrelor-figure-12.jpg (Ticagrelor Figure 12)
This text provides information on the comparison of Ticagrelor and Clopidogrel in patients with different dosages in the US and non-US regions. The data includes the number of patients, non-events, events, hazard ratios (HR), and 95% confidence intervals. The findings suggest that Ticagrelor may be better than Clopidogrel based on the comparison of these two medications.*
FDA Label Image

Ticagrelor-figure-13.jpg (Ticagrelor Figure 13)

Ticagrelor-figure-13.jpg (Ticagrelor Figure 13)
This text seems to show a comparison of outcomes between patients receiving Ti%0mg, Ti60mg, and Placebo over 36 months. It includes the number of patients experiencing events, Kaplan-Meier estimates at 36 months, Hazard Ratios, p-values, and the number of patients at risk at different time points. The data suggests a slight difference in outcomes between the different treatment groups.*
FDA Label Image

Ticagrelor-figure-14.jpg (Ticagrelor Figure 14)

Ticagrelor-figure-14.jpg (Ticagrelor Figure 14)
This text appears to contain statistical data related to the comparison of Ticagrelor versus Placebo in different characteristics such as age groups, gender, ethnicity, weight categories, geography, type of heart condition, kidney function, and types of treatments received. The data seems to include hazard ratios and confidence intervals for each characteristic, showing the effectiveness of Ticagrelor over Placebo. It is likely part of a medical or pharmaceutical study or analysis.*
FDA Label Image

Ticagrelor-figure-15.jpg (Ticagrelor Figure 15)

Ticagrelor-figure-15.jpg (Ticagrelor Figure 15)
This text provides data on the cumulative percentage of events over time in a clinical trial comparing Cangrelor to a placebo. It includes information on the number of participants at risk at various time points (in months) from randomization.*
FDA Label Image

Ticagrelor-figure-16.jpg (Ticagrelor Figure 16)

Ticagrelor-figure-16.jpg (Ticagrelor Figure 16)
This is a detailed analysis of patient characteristics, including age distribution, sex ratio, race, body mass index, geographic region, medication use, medical history (such as angina, multivessel coronary artery disease, PCI with stent, history of coronary artery bypass grafting), smoking status, duration of diabetes, and various clinical outcomes related to Ticagrelor and Placebo treatment. The data includes percentages and numerical values for each category, providing important insights for research or medical professionals involved in cardiovascular studies.*
FDA Label Image

Ticagrelor-figure-17.jpg (Ticagrelor Figure 17)

Ticagrelor-figure-17.jpg (Ticagrelor Figure 17)
The provided text seems to contain information regarding the results of a study comparing Ticagrelor 90 mg to a Placebo in participants. The data includes statistics on events, participants, percentages, and time points related to the study, such as cumulative percentages and days from randomization. The study may be related to the assessment of efficacy and safety profiles of Ticagrelor compared to Placebo over a certain period. The specific details of the study outcomes and methodology can be further analyzed for a comprehensive evaluation.*
FDA Label Image

Ticagrelor-figure-18.jpg (Ticagrelor Figure 18)

Ticagrelor-figure-18.jpg (Ticagrelor Figure 18)
This text appears to be a statistical analysis of a medical study, detailing the characteristics of the patients included in the analysis set. It provides information on demographics such as age, sex, race, weight, and geographic region. Additionally, it includes data on factors like diabetes mellitus, hypertension, smoking status, and previous medical history. The text also presents the effectiveness of a medication (Ticagrelor) compared to a placebo, with the associated hazard ratios and confidence intervals. The study seems to focus on the impact of the medication on various patient subgroups based on different characteristics.*
FDA Label Image

Ticagrelor-figure-2.jpg (Ticagrelor Figure 2)

FDA Label Image

Ticagrelor-figure-3.jpg (Ticagrelor Figure 3)

Ticagrelor-figure-3.jpg (Ticagrelor Figure 3)
This is a table showing the events for Ticagrelor and Placebo over a span of months from randomization. The table also provides the cumulative percentage over time for both groups. It seems to be related to a clinical study or trial comparing Ticagrelor versus Placebo.*
FDA Label Image

Ticagrelor-figure-4.jpg (Ticagrelor Figure 4)

FDA Label Image

Ticagrelor-figure-5.jpg (Ticagrelor Figure 5)

FDA Label Image

Ticagrelor-figure-6.jpg (Ticagrelor Figure 6)

Ticagrelor-figure-6.jpg (Ticagrelor Figure 6)
This text shows a table with data on Ticagrelor, Clopidogrel, and Placebo usage over time. It includes the percentages of each drug used on specific days.*
FDA Label Image

Ticagrelor-figure-7.jpg (Ticagrelor Figure 7)

FDA Label Image

Ticagrelor-figure-8.jpg (Ticagrelor Figure 8)

Ticagrelor-figure-8.jpg (Ticagrelor Figure 8)
This text provides information regarding interacting drugs with Ticagrelor, including recommended doses, strong and moderate CYP3A4 inhibitors, potent CYP3A4 inducers, and P-gP and CYP3A inhibitors. It outlines specific drug names, doses, and recommendations such as avoiding concomitant use, dose adjustments, or following specific dosage limits for certain medications. Additionally, it mentions the relative changes in pharmacokinetics (PK) for Cmax and AUC compared to a reference.*
FDA Label Image

Ticagrelor-figure-9.jpg (Ticagrelor Figure 9)

Ticagrelor-figure-9.jpg (Ticagrelor Figure 9)
This is a list of interacting drug combinations with Ticagrelor, along with the recommended mean effect and suggested dose adjustments based on the specific drug interaction. It includes a variety of medications such as Simvastatin, Atorvastatin, Levonorgestrel, Ethinyl Estradiol, Toloutarnide, Digoxin, and Cyclosporine, each with corresponding Ticagrelor doses and recommendations. The text also mentions that similar increases in AUC and Cmax were observed for all metabolites, and advises monitoring digoxin levels when initiating or changing Ticagrelor therapy.*
FDA Label Image

Str (Ticagrelor Str)

FDA Label Image

112 (Ticagrelor Tablets 60mg 60s)

112 (Ticagrelor Tablets 60mg 60s)
This is a medication information for Ticagrelor tablets of 60 mg strength. The tablets are dispensed with a Medication Guide available online. The usual adult dosage should be followed as per the package insert. The medication should be stored at a temperature range of 20° to 25°C. The manufacturer of this medication is Macleods Pharma USA, Inc. The tablets are coated and each tablet contains 60 mg of ticagrelor. The manufacturer of the tablets is Macleods Pharmaceuticals Ltd. located in Pithampur, India.*
FDA Label Image

113 (Ticagrelor Tablets 90mg 60s)

113 (Ticagrelor Tablets 90mg 60s)
This text provides information about a medication containing 90 mg of ticagrelor in film-coated tablets for adult usage. It includes storage instructions, dosage details, and a warning message for pharmacists. The product seems to be from Macleods Pharma USA, Inc., a pharmaceutical company located in Princeton, New Jersey, with manufacturing facilities in India.*

* These product label images have been analyzed using experimental machine learning. Please verify findings with the primary label text.