Nintedanib Esylate Capsule
Product Images NDC 33342-550

View Photos of Packaging, Regulatory Labels, and Product Appearance

Product Visual Gallery

This gallery contains 9 technical images submitted to the FDA as part of the official labeling for Nintedanib Esylate (NDC 33342-550). Unlike standard consumer photos, these assets often include clinical data figures, molecular chemical structures, and official manufacturer packaging layouts.

As provided by Macleods Pharmaceuticals Limited, these visuals offer a comprehensive scientific overview of the product's physical and chemical identity, aiding pharmacists and researchers in product verification and study.

FDA Label Image

667 (Nintedanib Capsule 100mg Container)
667 (Nintedanib Capsule 100mg Container)
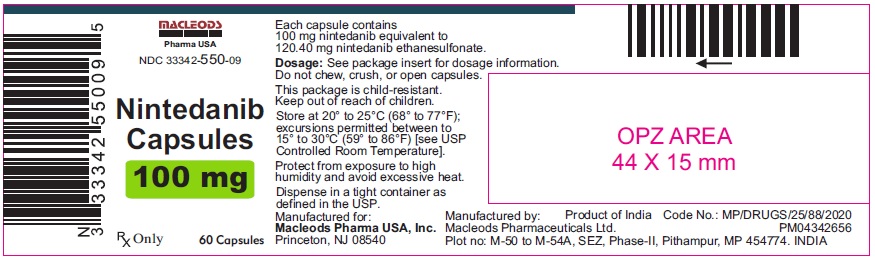
Nintedanib Capsules 100 mg oral capsules label provided by Macleods Pharmaceuticals Limited. The label indicates 60 capsules per bottle and includes storage instructions, dosage caution, and manufacturer details for Macleods Pharma USA, Inc. The label also includes the NDC number 33342-550-09 and specifies the active ingredient equivalence to nintedanib ethanesulfonate.*
FDA Label Image

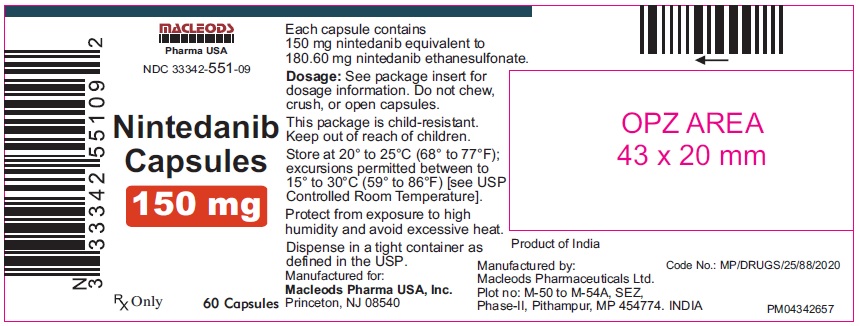
909 (Nintedanib Capsule 150mg Container)

909 (Nintedanib Capsule 150mg Container)
Label for Nintedanib Capsules 150 mg by Macleods Pharmaceuticals Limited. The label includes the NDC 33342-551-09 and indicates a package containing 60 capsules. It specifies that each capsule contains 150 mg nintedanib equivalent to 180.60 mg nintedanib ethanesulfonate. Storage and safety instructions are noted, including child-resistant packaging and temperature guidelines.*
FDA Label Image

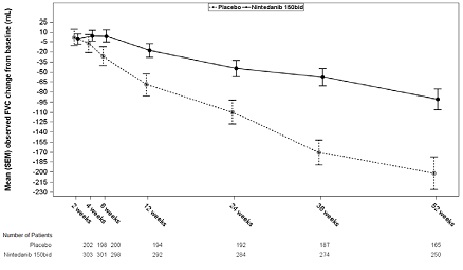
Nintedanib-fig-1 (Nintedanib Figure 1)

Nintedanib-fig-1 (Nintedanib Figure 1)
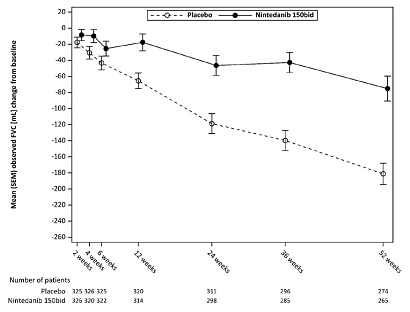
A line graph comparing mean observed FVC (Forced Vital Capacity) change from baseline (mL) over 52 weeks between placebo and Nintedanib 150 mg twice daily groups. The graph includes time points at 2, 6, 12, 24, 36, and 52 weeks. Error bars show variability, and patient counts at each time point are listed below for both groups.*
FDA Label Image

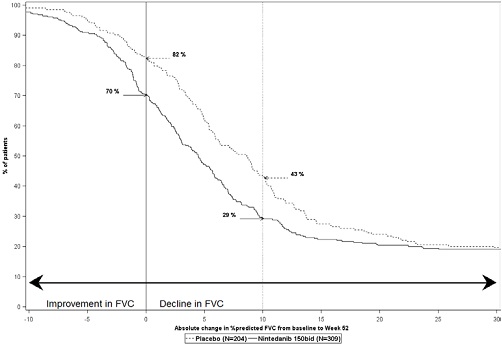
Nintedanib-fig-2 (Nintedanib Figure 2)

Nintedanib-fig-2 (Nintedanib Figure 2)
A Kaplan-Meier style plot showing the percentage of patients over time in weeks from baseline to week 52, with two curves comparing the absolute change in percent-predicted FVC between placebo (N=204) and Nintedanib 150 mg. The graph illustrates improvement and decline in FVC marked on the x-axis and percentage of patients on the y-axis.*
FDA Label Image

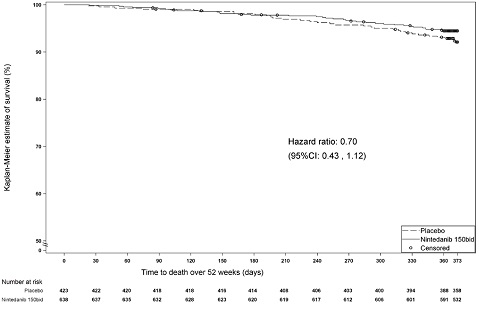
Nintedanib-fig-3 (Nintedanib Figure 3)

Nintedanib-fig-3 (Nintedanib Figure 3)
A Kaplan-Meier survival curve displaying the estimate of survival (%) over time in days up to 373 days (approximately 52 weeks). The graph compares two groups: Placebo and Nintedanib 150 mg, with a hazard ratio of 0.70 (95% CI: 0.43, 1.12). The x-axis represents time to death over 52 weeks, and the y-axis shows the survival percentage. Numbers at risk are listed below the x-axis for both groups at various time points.*
FDA Label Image

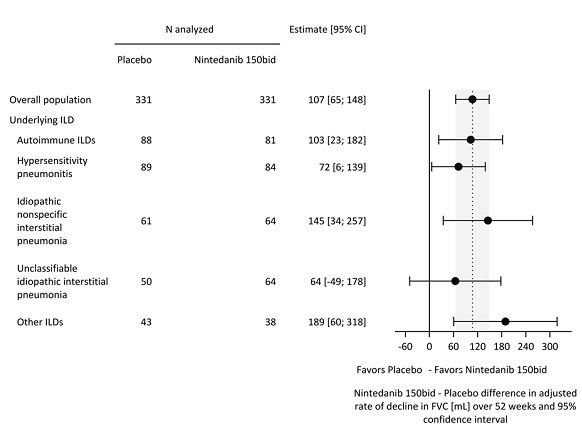
Nintedanib-fig-4 (Nintedanib Figure 4)

Nintedanib-fig-4 (Nintedanib Figure 4)
A forest plot chart comparing the effect of Nintedanib 150 mg twice daily versus placebo on the rate of decline in forced vital capacity (FVC) in various subgroups, including overall population and different types of interstitial lung diseases (ILDs). The plot shows the estimate and 95% confidence intervals for each subgroup, indicating whether the data favors placebo or Nintedanib 150 mg twice daily.*
FDA Label Image

Nintedanib-fig-5 (Nintedanib Figure 5)

Nintedanib-fig-5 (Nintedanib Figure 5)
A line graph comparing mean observed FVC (ml) changes from baseline over several weeks for placebo and Nintedanib 150 mg BID, including error bars and patient numbers over time. The x-axis represents time points from baseline to 52 weeks, and the y-axis shows FVC change in ml.*
FDA Label Image

Nintedanib-fig-6 (Nintedanib Figure 6)

Nintedanib-fig-6 (Nintedanib Figure 6)
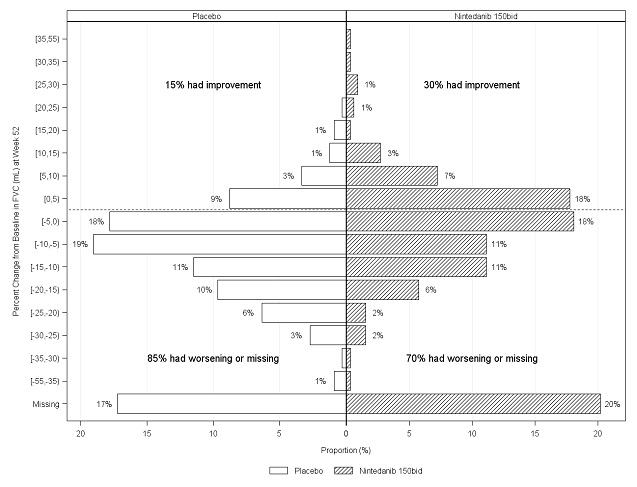
A horizontal bar chart comparing the proportion of subjects with percent change from baseline in FVC (mL) at Week 52 between Placebo and Nintedanib 150 mg twice daily. The chart shows categories of improvement, worsening, or missing data, with proportions labeled for each group. Placebo group had 15% improvement and 85% worsening or missing, while Nintedanib 150 mg bid had 30% improvement and 70% worsening or missing.*
FDA Label Image

Nintedanib-str (Nintedanib Structure)

Nintedanib-str (Nintedanib Structure)
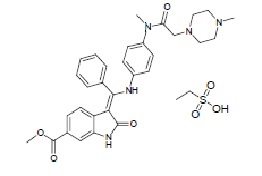
Chemical structure of Nintedanib esylate, showing its molecular components including a naphthalene-based core and sulfonic acid moiety.*

* About these descriptions: Image descriptions on this page are generated by automated AI analysis of the product label images from the manufacturer's FDA label submission (SPL). They are provided for reference only and may contain errors or omissions. Always rely on the printed label itself and the official FDA labeling, and consult a pharmacist or healthcare professional with any questions about this product.