Dapagliflozin Tablet
Product Images NDC 33342-585

10 FDA label images from Macleods Pharmaceuticals Limited · Packaging, Regulatory Labels, and Product Appearance

Product Visual Gallery

This gallery contains 10 technical images submitted to the FDA as part of the official labeling for Dapagliflozin (NDC 33342-585). Unlike standard consumer photos, these assets often include clinical data figures, molecular chemical structures, and official manufacturer packaging layouts.

As provided by Macleods Pharmaceuticals Limited, these visuals offer a comprehensive scientific overview of the product's physical and chemical identity, aiding pharmacists and researchers in product verification and study.

FDA Label Image

556 (Dapagliflozin Stru)
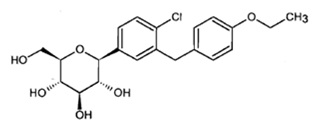
556 (Dapagliflozin Stru)
Chemical structure diagram of dapagliflozin, showing its molecular components and arrangement including hydroxyl groups, chloride-substituted aromatic ring, and ether linkages.*
FDA Label Image

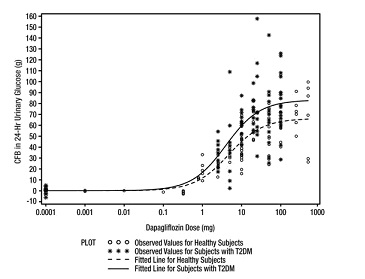
505 (Dapagliflozin Fig 1)

505 (Dapagliflozin Fig 1)
A scatter plot graph showing observed values and fitted lines for 24-hour urinary glucose excretion (CFB) versus dapagliflozin dose in mg. The plot differentiates between healthy subjects and subjects with type 2 diabetes mellitus (T2DM) using different markers and fitted lines to represent their responses across a range of doses from 0.0001 to 1000 mg.*
FDA Label Image

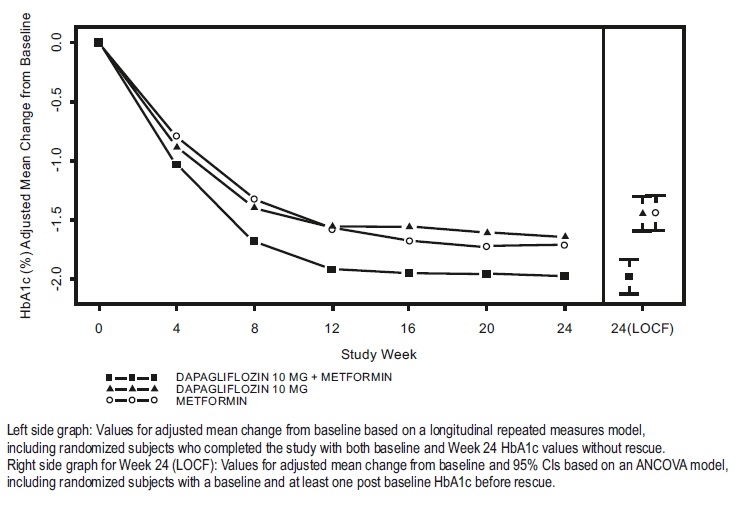
658 (Dapagliflozin Fig 2)

658 (Dapagliflozin Fig 2)
A line chart comparing adjusted mean percent change from baseline in HbA1c over 24 weeks for three groups: dapagliflozin 10 mg plus metformin, dapagliflozin 10 mg alone, and metformin alone. The study week is on the x-axis, and HbA1c percent change is on the y-axis, showing progressive reduction in all groups with dapagliflozin plus metformin having the greatest decrease.*
FDA Label Image

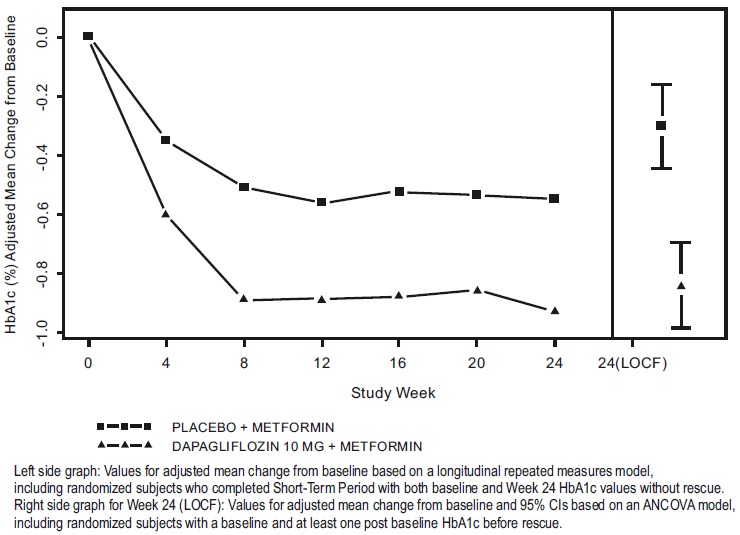
575 (Dapagliflozin Figure 3)

575 (Dapagliflozin Figure 3)
A line graph showing the adjusted mean change in HbA1c (%) from baseline over 24 study weeks for two groups: Placebo + Metformin and Dapagliflozin 10 mg + Metformin. The Dapagliflozin group shows a greater reduction in HbA1c compared to placebo. The graph includes error bars representing 95% confidence intervals at week 24 (LOCF).*
FDA Label Image

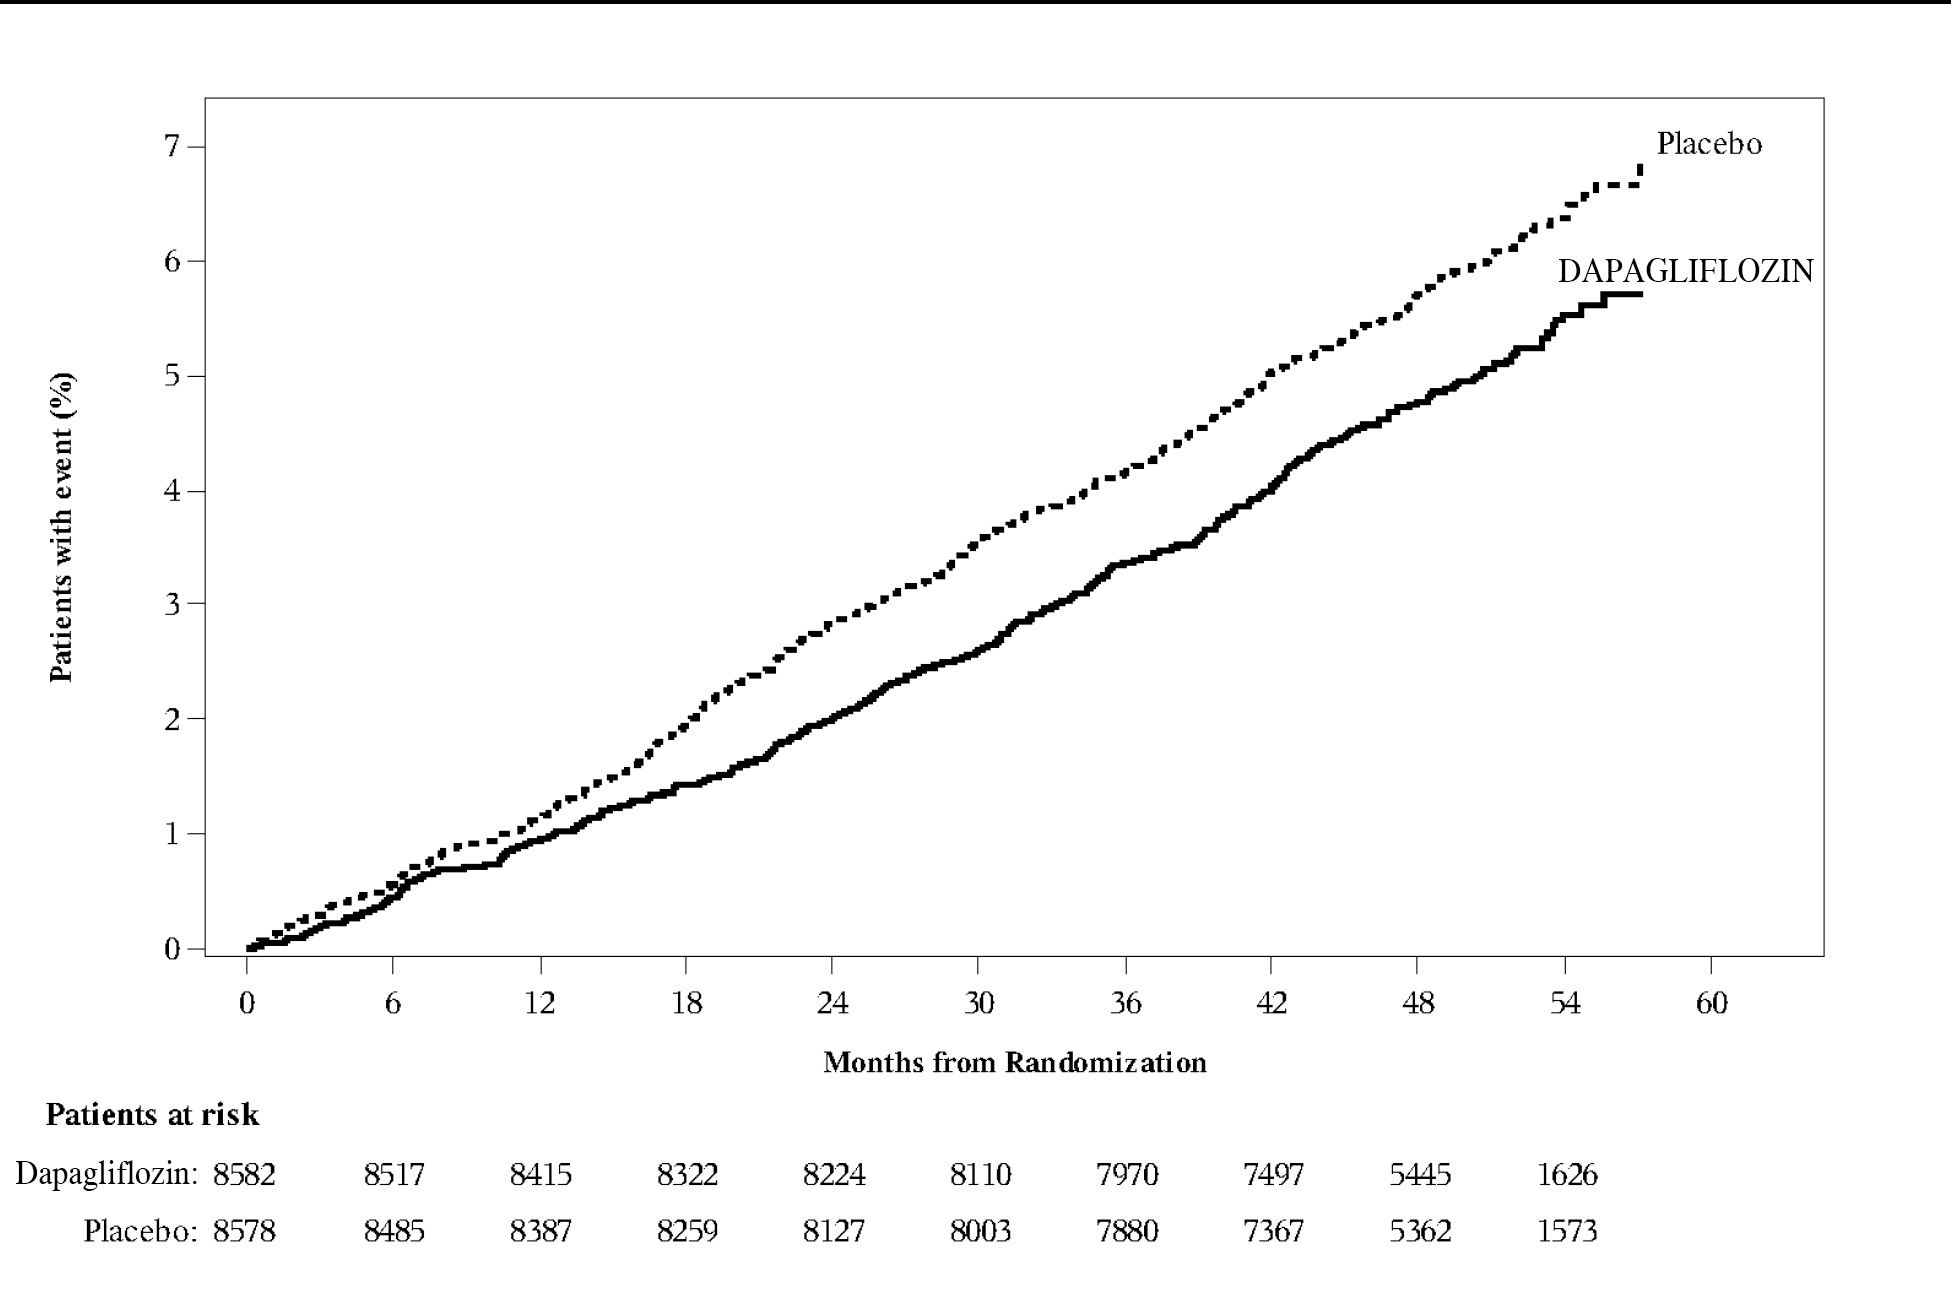
505 (Dapagliflozin Figure 4)

505 (Dapagliflozin Figure 4)
A cumulative incidence graph depicting the percentage of patients with an event over months from randomization for dapagliflozin versus placebo groups. The y-axis represents patients with events (%) and the x-axis shows months from randomization up to about 54 months. Two step curves labeled "DAPAGLIFOZIN" (solid) and "Placebo" (dotted) illustrate lower event incidence over time with dapagliflozin compared to placebo. Below the graph numbers indicate patients at risk for both groups over time.*
FDA Label Image

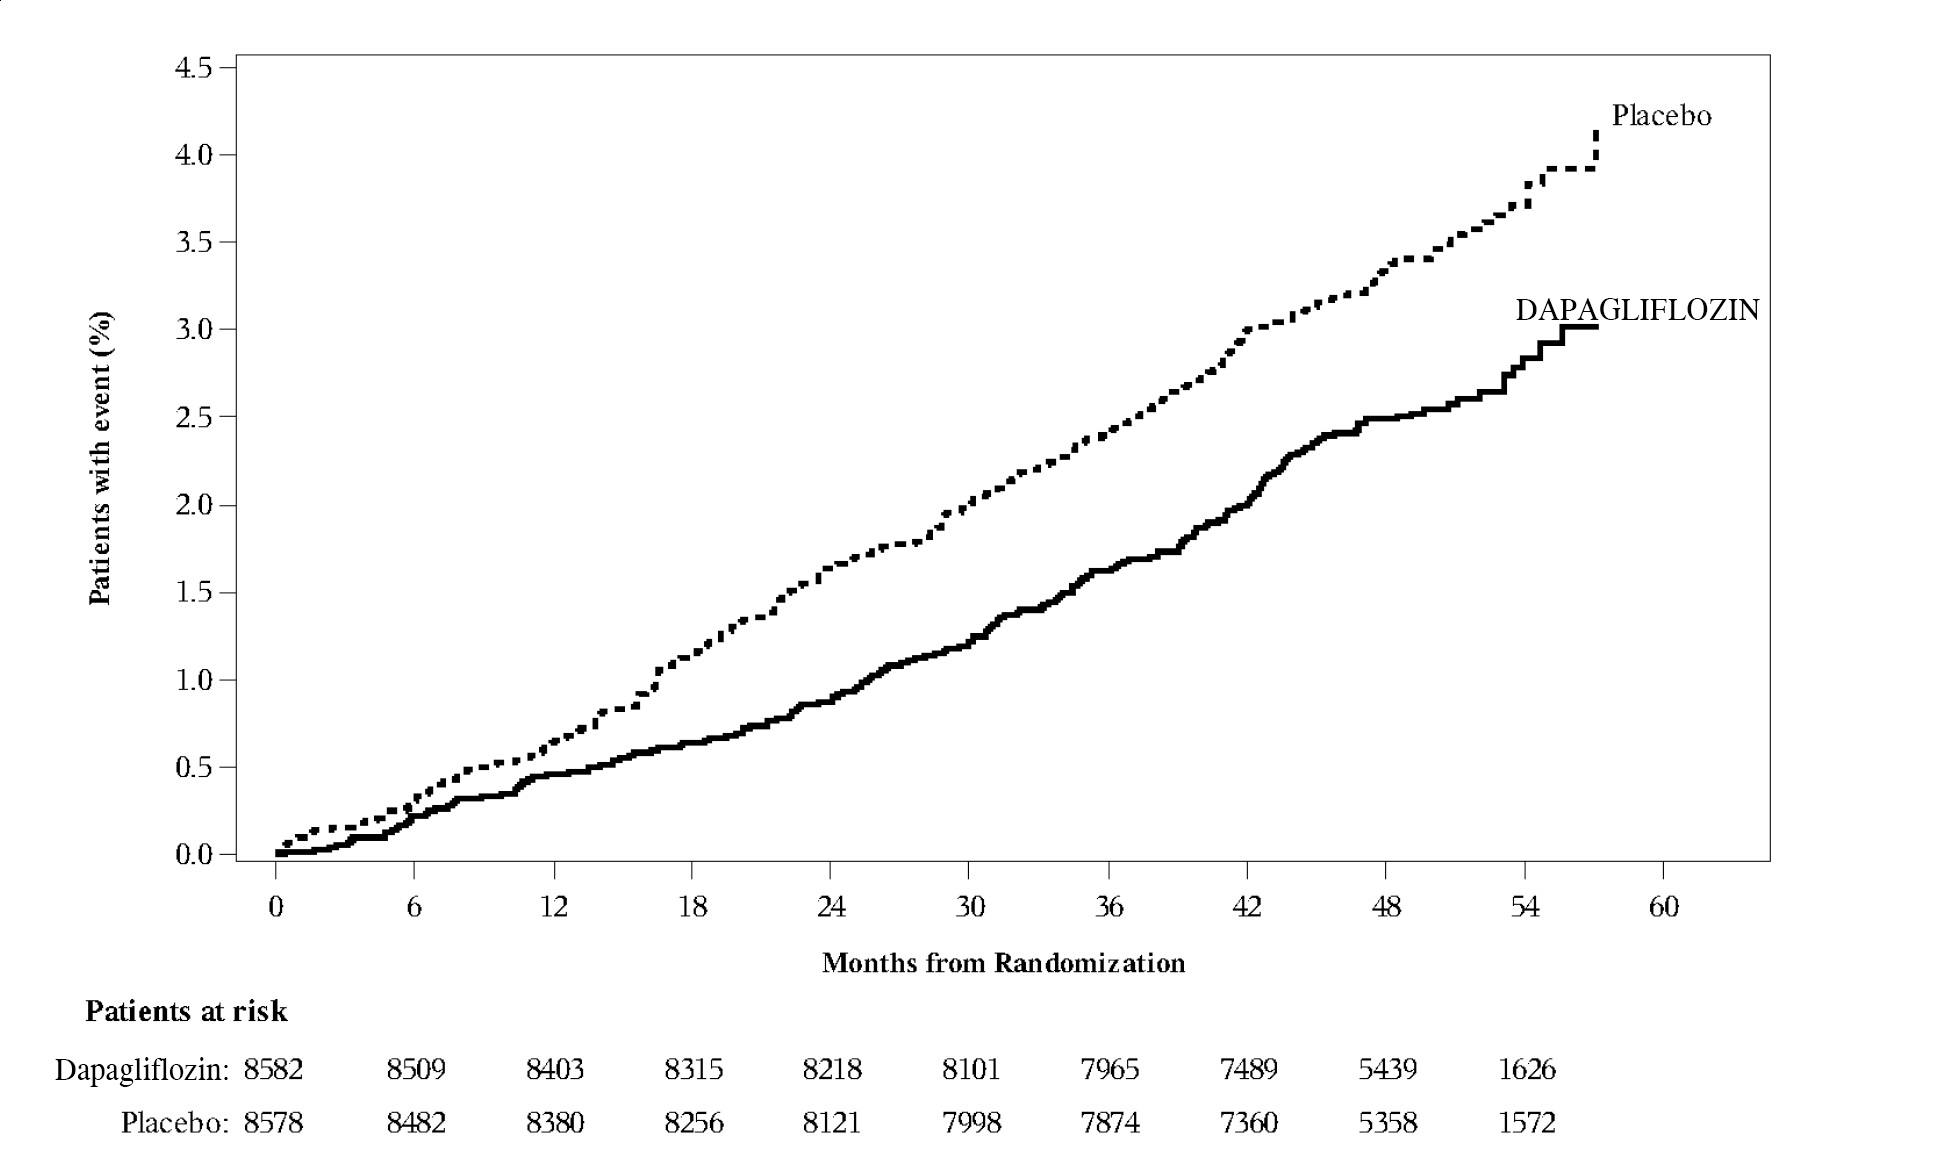
505 (Dapagliflozin Figure 5)

505 (Dapagliflozin Figure 5)
A line graph showing the percentage of patients with an event over time in months from randomization comparing dapagliflozin and placebo groups. The y-axis represents patients with event (%) from 0.0 to 4.5%, and the x-axis shows months from 0 to 60. Two lines represent dapagliflozin and placebo, with data points for patients at risk listed below the graph.*
FDA Label Image

585 (Dapagliflozin 5mg 30s)

FDA Label Image

879 (Dapagliflozin 5mg 90s)

FDA Label Image

546 (Dapagliflozin 10mg 30s)

FDA Label Image

546 (Dapagliflozin 10mg 90s)

* About these descriptions: Image descriptions on this page are generated by automated AI analysis of the product label images from the manufacturer's FDA label submission (SPL). They are provided for reference only and may contain errors or omissions. Always rely on the printed label itself and the official FDA labeling, and consult a pharmacist or healthcare professional with any questions about this product.