Figure1 (Figure1)

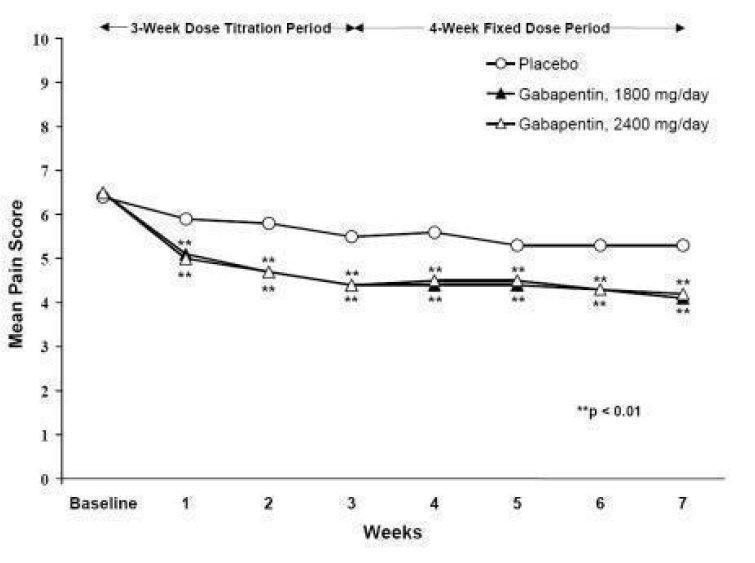
This appears to be a table or a chart showing mean pain scores for various treatments over a period of time. The treatments include placebo and gabapentin at a dose of 3600mg/day. The chart also shows a baseline score and scores from weeks 1 to 8 during the fixed-dose period. The text does not provide more information, such as the condition being treated or the method of evaluation, making it difficult to interpret the results.*