N/a Tablet, Film Coated
Product Images NDC 35561-254

View Photos of Packaging, Regulatory Labels, and Product Appearance

Product Visual Gallery

This gallery contains 17 technical images submitted to the FDA as part of the official labeling for N/a (NDC 35561-254). Unlike standard consumer photos, these assets often include clinical data figures, molecular chemical structures, and official manufacturer packaging layouts.

As provided by Bostal Llc, these visuals offer a comprehensive scientific overview of the product's physical and chemical identity, aiding pharmacists and researchers in product verification and study.

FDA Label Image

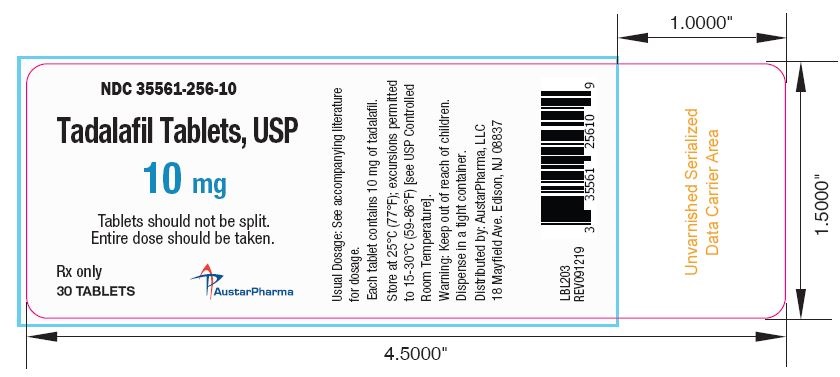
10mg-30 (10mg 30)

10mg-30 (10mg 30)
Label for Tadalafil Tablets, USP 10 mg, film-coated oral tablets. The label shows the NDC number 35561-256-10 and states tablets should not be split. The package contains 30 tablets, is Rx only, and is distributed by AustarPharma, LLC. The label includes storage and dispensing instructions alongside a barcode and serialization area.*
FDA Label Image

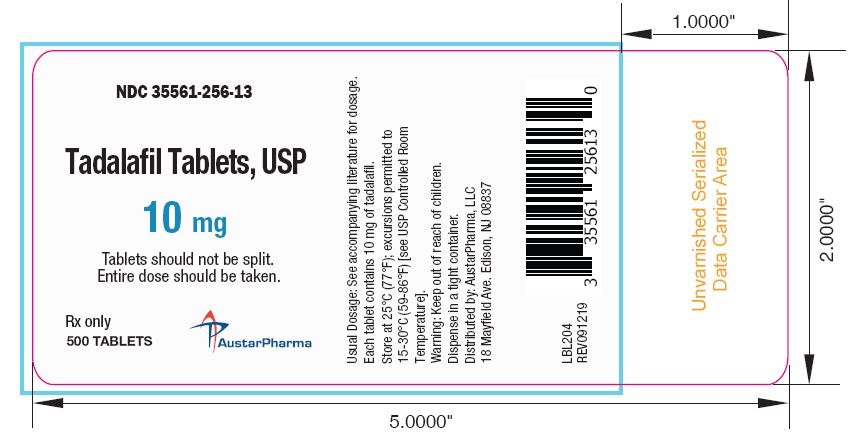
10mg-500 (10mg 500)

10mg-500 (10mg 500)
Label for Tadalafil Tablets, USP 10 mg film-coated oral tablets, RX only, containing 500 tablets. Label includes storage instructions, usage dosage note, manufacturer AustarPharma, and barcode. Dimensions and data carrier area noted on label.*
FDA Label Image

2-5mg-30 (2 5mg 30)

2-5mg-30 (2 5mg 30)
Tadalafil Tablets, USP 2.5 mg film-coated tablets label from Bostal LLC. The label includes the NDC number 35561-254-10, instructions that tablets should not be split and entire dose should be taken, and indicates prescription use only with a package size of 30 tablets. Storage and handling instructions, manufacturer details, and a barcode are also visible on the label.*
FDA Label Image

2-5mg-500 (2 5mg 500)

2-5mg-500 (2 5mg 500)
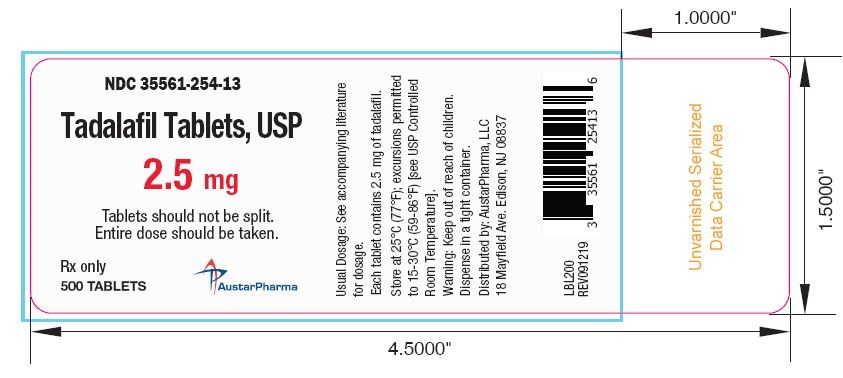
Label for Tadalafil Tablets, USP 2.5 mg oral film-coated tablets, packaged as 500 tablets. The label includes dosage warnings about not splitting tablets, storage instructions, and is labeled for Rx only. Distributed by AustarPharma, LLC, Edison, NJ, this label displays an NDC number 35561-254-13 and a barcode.*
FDA Label Image

20mg-30 (20mg 30)

20mg-30 (20mg 30)
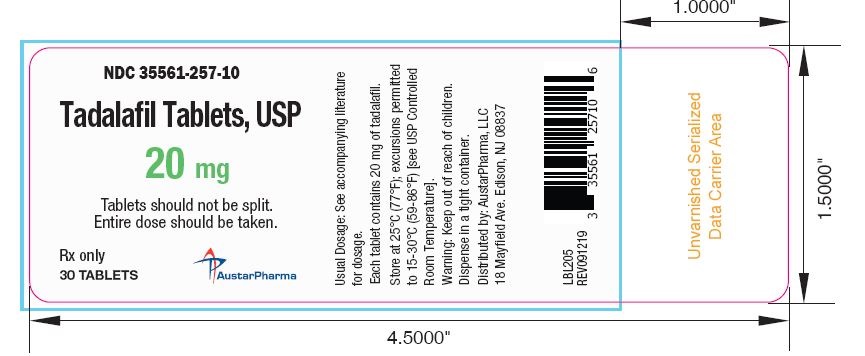
Label for Tadalafil Tablets, USP 20 mg, film-coated oral tablets. The label states tablets should not be split and the entire dose should be taken. It includes quantity of 30 tablets and the labeler is AustarPharma, a division of Bostal LLC. Storage and dispensing warnings along with a barcode are present.*
FDA Label Image

20mg-500 (20mg 500)

20mg-500 (20mg 500)
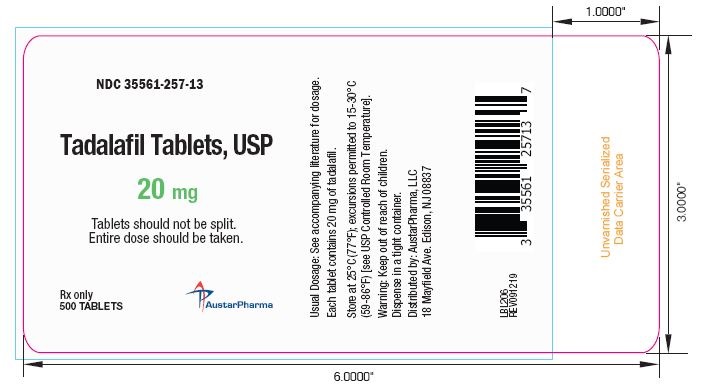
Label for Tadalafil Tablets, USP 20 mg, film-coated, oral dosage form. The label states tablets should not be split and the entire dose should be taken. It indicates a quantity of 500 tablets and Rx only. Labeler is Bostal LLC. The label includes a barcode and storage instructions, with dimensions outlined for printing.*
FDA Label Image

5mg-30 (5mg 30)

5mg-30 (5mg 30)
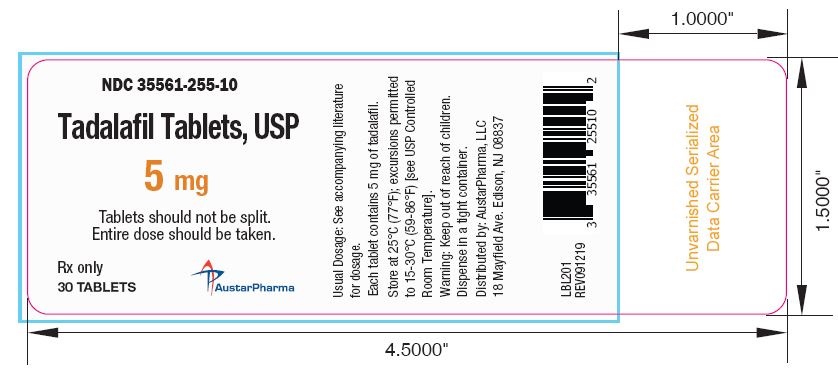
Label for Tadalafil Tablets USP, 5 mg, film-coated oral tablets. The label indicates the package contains 30 tablets and states that tablets should not be split and the entire dose should be taken. It includes the NDC 35561-255-10 and is distributed by AustarPharma LLC, Edison, NJ. The label also features storage instructions and a barcode.*
FDA Label Image

5mg-500 (5mg 500)

5mg-500 (5mg 500)
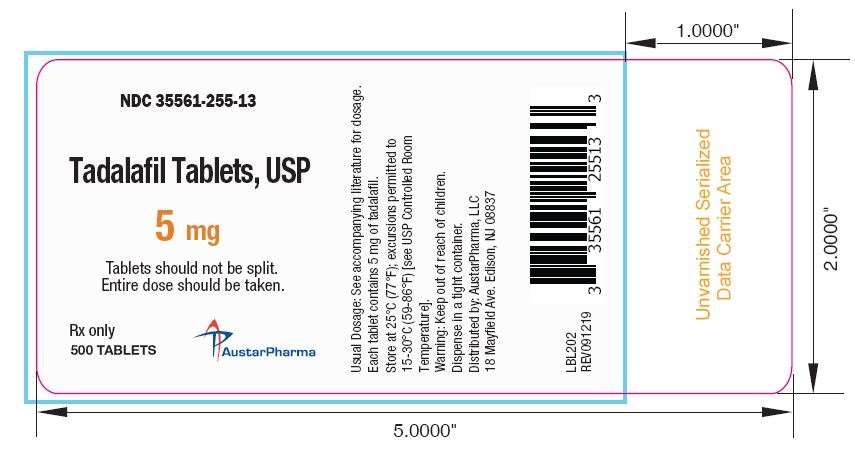
Label for Tadalafil Tablets, USP 5 mg film-coated tablets. The label includes the NDC number 35561-255-13 and indicates that tablets should not be split and the entire dose should be taken. The package contains 500 tablets. It is distributed by Austar Pharma, located in Edison, NJ. Storage and dispensing information are also noted on the label.*
FDA Label Image

Figure1 (Figure1)

Figure1 (Figure1)
A set of four line graphs showing mean maximal change in blood pressure (difference between tadalafil and placebo) over time up to 96 hours after the last dose of tadalafil 20 mg or placebo. The graphs depict standing systolic, standing diastolic, supine systolic, and supine diastolic blood pressure changes in response to sublingual nitroglycerin, with 90% confidence intervals at various time points (2, 4, 8, 24, 48, 72, 96 hours). The vertical axis is blood pressure difference in mmHg; the horizontal axis is time in hours.*
FDA Label Image

Figure2 (Figure2)

Figure2 (Figure2)
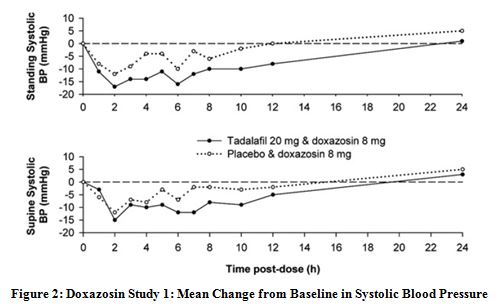
A two-panel line graph showing the mean change from baseline in systolic blood pressure over 24 hours post-dose in a Doxazosin study. The top panel shows standing systolic BP changes, and the bottom panel shows supine systolic BP changes. Each panel compares results between Tadalafil 20 mg with doxazosin 8 mg versus placebo with doxazosin 8 mg over time.*
FDA Label Image

Figure3 (Figure3)

Figure3 (Figure3)
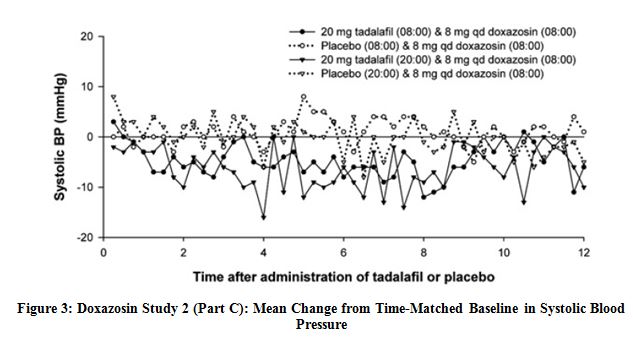
A line graph titled 'Doxazosin Study 2 (Part C): Mean Change from Time-Matched Baseline in Systolic Blood Pressure' comparing systolic blood pressure changes (mmHg) over 12 hours after administration of tadalafil or placebo combined with doxazosin. The graph shows four data series: 20 mg tadalafil at 8:00 & 8 mg doxazosin at 8:00; placebo at 8:00 & 8 mg doxazosin at 8:00; 20 mg tadalafil at 20:00 & 8 mg doxazosin at 8:00; and placebo at 20:00 & 8 mg doxazosin at 8:00.*
FDA Label Image

Figure4 (Figure4)

Figure4 (Figure4)
A line graph depicting plasma tadalafil concentrations (mean ± SD) over time (hours) following oral administration. It compares a single 20-mg tadalafil dose, a single 5-mg tadalafil dose, and once-daily 5-mg tadalafil after 5 consecutive days. Concentration is plotted on the y-axis in µg/L, time on the x-axis up to 120 hours, showing declining plasma levels over time for each dosing regimen.*
FDA Label Image

Figure5 (Figure5)

Figure5 (Figure5)
A line graph showing mean changes in IPSS scores over 12 weeks of treatment for BPH patients, comparing Tadalafil 5 mg (solid line with circles) and placebo (dashed line with triangles). The x-axis represents duration of treatment in weeks, and the y-axis represents change from baseline IPSS total score. The graph shows a greater decrease in scores for Tadalafil 5 mg compared to placebo.*
FDA Label Image

Figure6 (Figure6)

Figure6 (Figure6)
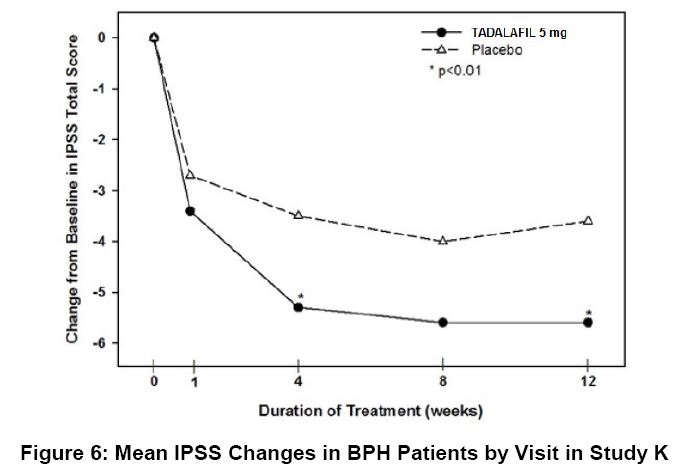
A line graph showing mean changes from baseline in IPSS total score over 12 weeks comparing Tadalafil 5 mg tablets versus placebo in BPH patients. The x-axis represents duration of treatment in weeks, and the y-axis represents change in IPSS score. Tadalafil demonstrates greater score reduction than placebo over time, with significance noted at certain points (p<0.01).*
FDA Label Image

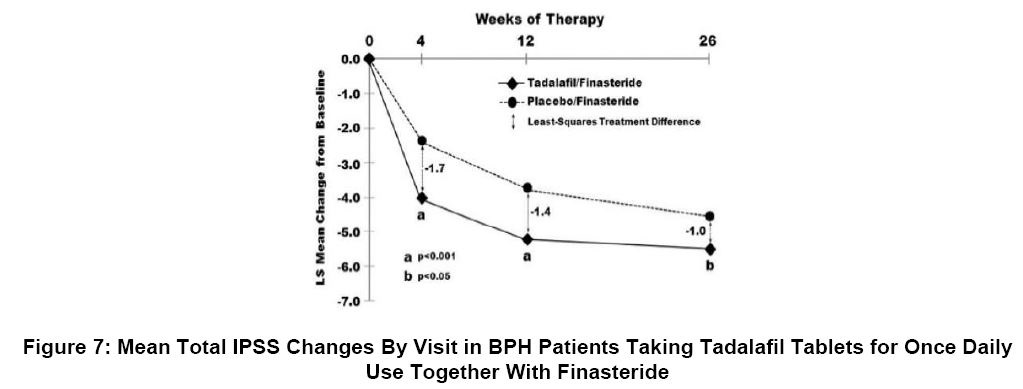
Figure7 (Figure7)

Figure7 (Figure7)
A line chart showing mean total IPSS changes over 26 weeks in BPH patients taking tadalafil tablets once daily with finasteride versus placebo with finasteride. The x-axis represents weeks of therapy, and the y-axis shows least squares mean change from baseline. Two lines compare treatment groups, with data points and significance annotations (p<0.001, p<0.05).*
FDA Label Image

Figure8 (Figure8)

Figure8 (Figure8)
A line graph showing mean IPSS total score changes over a 12-week treatment duration comparing Tadalafil 5 mg and placebo. The graph plots change from baseline on the y-axis and treatment duration in weeks on the x-axis, with Tadalafil demonstrating a greater score reduction than placebo.*
FDA Label Image

Structure (Structure)

Structure (Structure)
Chemical structure diagram of tadalafil, showing its molecular framework with fused rings and functional groups as labeled in the image.*

* About these descriptions: Image descriptions on this page are generated by automated AI analysis of the product label images from the manufacturer's FDA label submission (SPL). They are provided for reference only and may contain errors or omissions. Always rely on the printed label itself and the official FDA labeling, and consult a pharmacist or healthcare professional with any questions about this product.