Figure 1 (Finasteride Fig1)
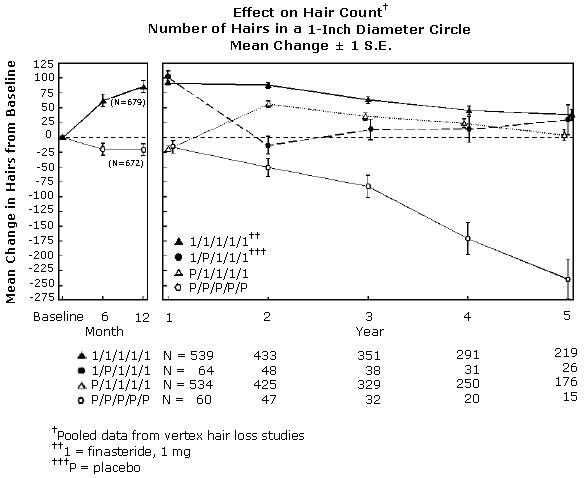
This appears to be a data table showing the mean change in hair count for a study involving finasteride and a placebo. The table shows the number of hairs in a 1-inch diameter circle and the mean change + 1 S.E. over the course of 6 months. The data is categorized by month, year, and treatment group (finasteride or placebo), with corresponding numbers of hairs counted.*