Carglumic Acid Tablet, For Suspension
Product Images NDC 35573-459

View Photos of Packaging, Regulatory Labels, and Product Appearance

Product Visual Gallery

This gallery contains 4 technical images submitted to the FDA as part of the official labeling for Carglumic Acid (NDC 35573-459). Unlike standard consumer photos, these assets often include clinical data figures, molecular chemical structures, and official manufacturer packaging layouts.

As provided by Burel Pharmaceuticals, Llc, these visuals offer a comprehensive scientific overview of the product's physical and chemical identity, aiding pharmacists and researchers in product verification and study.

FDA Label Image

1 (5d8ac14d Dd85 4d80 9e3d 07a52e1f72ab 01)

1 (5d8ac14d Dd85 4d80 9e3d 07a52e1f72ab 01)
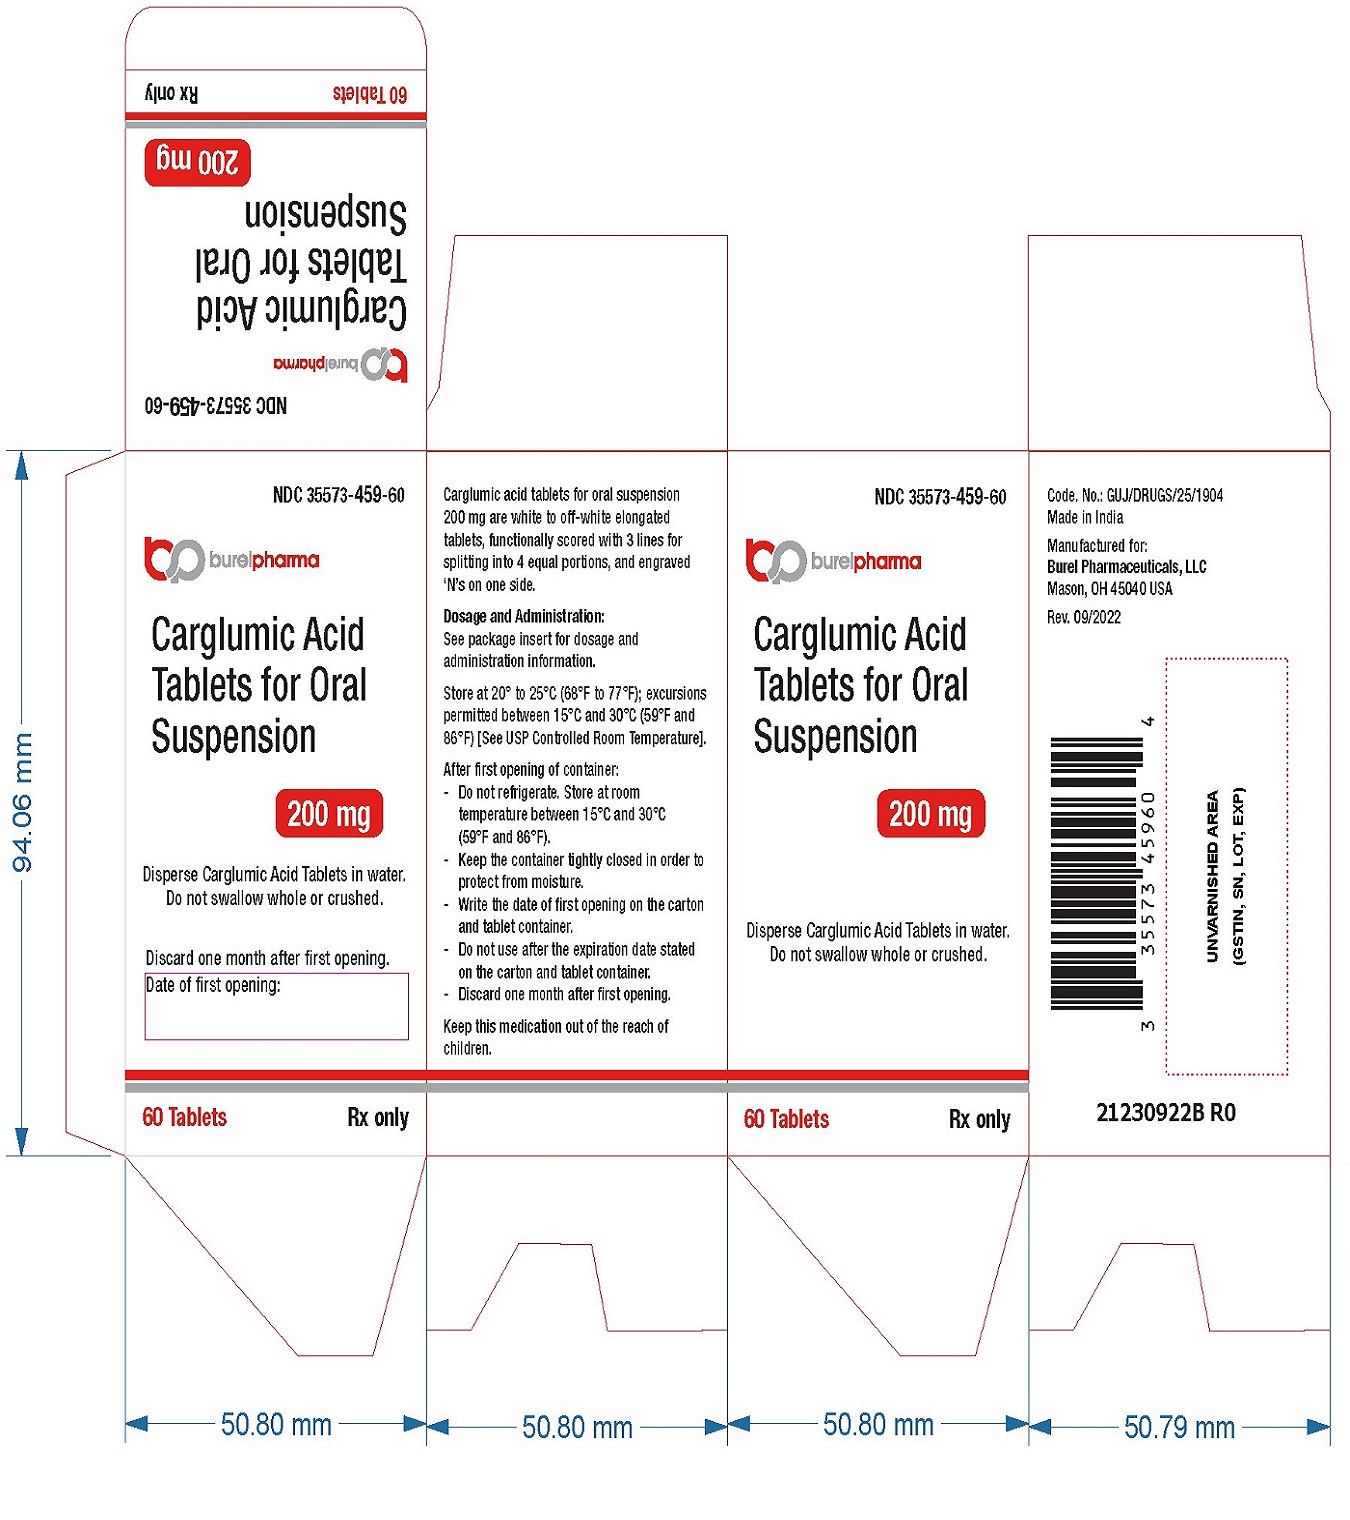
Label for Carglumic Acid Tablets for Oral Suspension, 200 mg, manufactured by Burel Pharmaceuticals, LLC. The label includes dosage and administration instructions, storage conditions, NDC 35573-459-60, a barcode, and a warning to keep out of reach of children. The package contains 60 tablets, Rx only.*
FDA Label Image

2 (5d8ac14d Dd85 4d80 9e3d 07a52e1f72ab 02)

2 (5d8ac14d Dd85 4d80 9e3d 07a52e1f72ab 02)
Label panel for Carglumic Acid Tablets for Oral Suspension 200 mg by Burel Pharmaceuticals, LLC. The tablets are white to off-white, elongated, and scored for splitting. The label shows storage instructions, dosage reference to the package insert, packaging of 60 tablets, and notes to disperse tablets in water before use. Manufactured in India with directions for use and expiry tracking on the carton.*
FDA Label Image

Image (5d8ac14d Dd85 4d80 9e3d 07a52e1f72ab 195 1)

Image (5d8ac14d Dd85 4d80 9e3d 07a52e1f72ab 195 1)
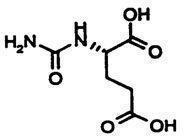
Chemical structure diagram of carglumic acid showing its molecular components, including amino and carboxyl functional groups, consistent with the generic drug carglumic acid.*
FDA Label Image

Image (5d8ac14d Dd85 4d80 9e3d 07a52e1f72ab 220 1)

Image (5d8ac14d Dd85 4d80 9e3d 07a52e1f72ab 220 1)
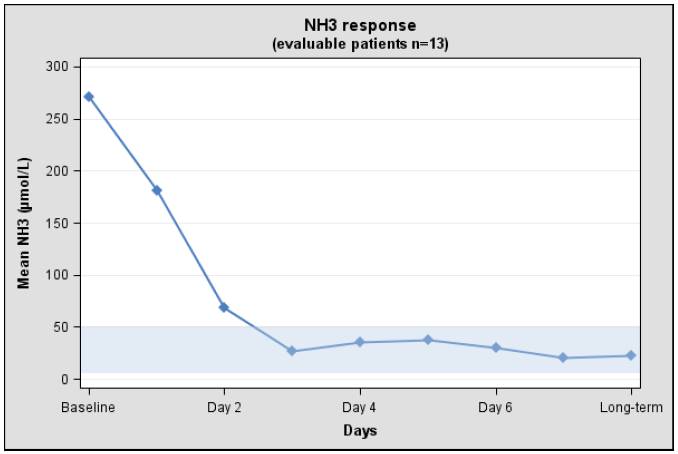
A line graph titled 'NH3 response (evaluable patients n=13)' showing mean ammonia (NH3) levels in µmol/L on the Y-axis and days on the X-axis. The graph depicts a sharp decline in mean NH3 from baseline through Day 2, with levels stabilizing and fluctuating mildly from Day 4 to long-term.*

* About these descriptions: Image descriptions on this page are generated by automated AI analysis of the product label images from the manufacturer's FDA label submission (SPL). They are provided for reference only and may contain errors or omissions. Always rely on the printed label itself and the official FDA labeling, and consult a pharmacist or healthcare professional with any questions about this product.