Argatroban Injection
Product Images NDC 42023-182

View Photos of Packaging, Regulatory Labels, and Product Appearance

Product Visual Gallery

This gallery contains 6 technical images submitted to the FDA as part of the official labeling for Argatroban (NDC 42023-182). Unlike standard consumer photos, these assets often include clinical data figures, molecular chemical structures, and official manufacturer packaging layouts.

As provided by Par Health Usa, Llc, these visuals offer a comprehensive scientific overview of the product's physical and chemical identity, aiding pharmacists and researchers in product verification and study.

FDA Label Image

Chemical Structure (Argatroban 1)
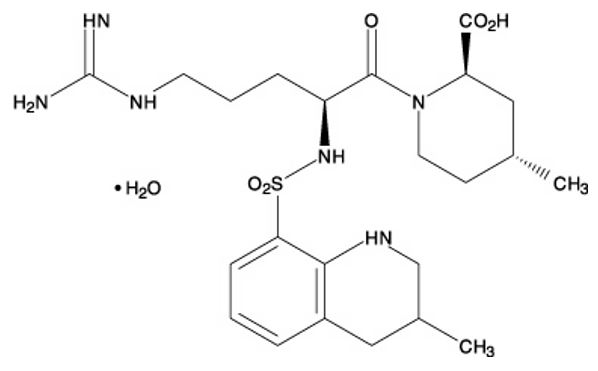
Chemical Structure (Argatroban 1)
Chemical structure diagram of Argatroban showing its molecular connectivity, including guanidine, carboxylic acid, sulfonamide, and piperidine groups, represented with standard chemical bond notation.*
FDA Label Image

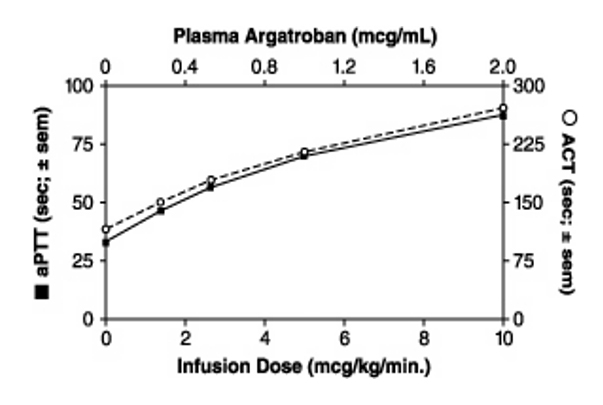
Figure 1 (Argatroban 2)

Figure 1 (Argatroban 2)
A line graph depicting the relationship between argatroban infusion dose (mcg/kg/min) on the x-axis and clotting times on the y-axes. The left y-axis shows aPTT (seconds ± sem) and the right y-axis shows ACT (seconds ± sem). The graph includes data points with aPTT represented by filled squares and ACT represented by open circles, both increasing with higher infusion doses and plasma argatroban concentrations (mcg/mL) noted along the top x-axis.*
FDA Label Image

Figure2 (Argatroban 3)

Figure2 (Argatroban 3)
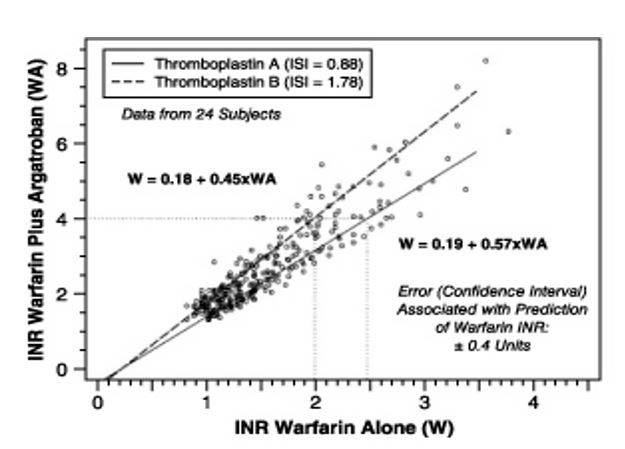
A scatter plot comparing INR Warfarin Plus Argatroban (WA) versus INR Warfarin Alone (W) in 24 subjects. The graph features two linear regression lines for Thromboplastin A (ISI = 0.88) and Thromboplastin B (ISI = 1.78), each with corresponding equations, illustrating the relationship and prediction error of Warfarin INR values.*
FDA Label Image

Figure 3 (Argatroban 4)

Figure 3 (Argatroban 4)
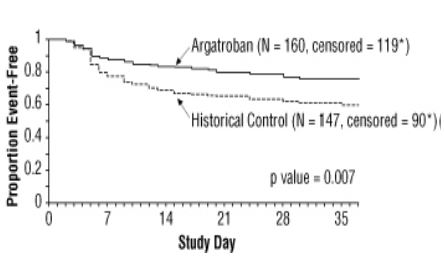
A Kaplan-Meier curve comparing the proportion of event-free participants over 35 study days between Argatroban (N=160) and a historical control group (N=147). The graph shows higher event-free survival in the Argatroban group with a p value of 0.007 indicating statistical significance.*
FDA Label Image

Figure 4 (Argatroban 5)

Figure 4 (Argatroban 5)
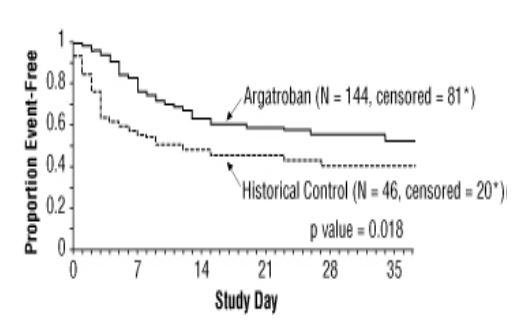
A line graph comparing the proportion of event-free subjects over a 35-day study period between Argatroban (N=144) and a Historical Control group (N=46). The graph shows higher event-free proportion for Argatroban throughout the study, with a noted p value of 0.018 indicating statistical comparison.*
FDA Label Image

This Is An Image Of The Argatroban Injection Carton, 250 mg/2.5 mL (100 mg/ml), Premier Pro Rx. (Argatroban 6)

This Is An Image Of The Argatroban Injection Carton, 250 mg/2.5 mL (100 mg/ml), Premier Pro Rx. (Argatroban 6)
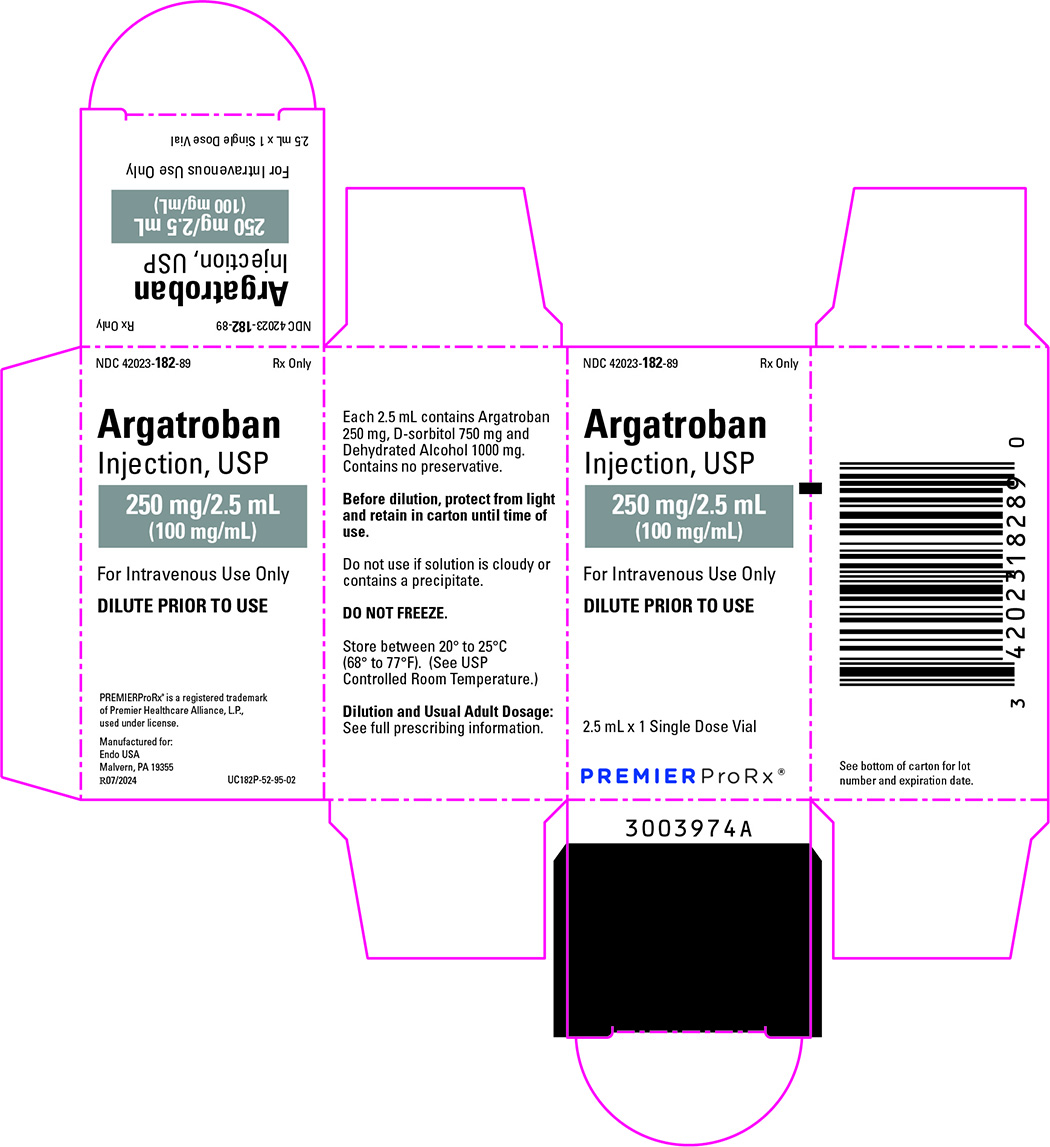
Argatroban Injection, USP 250 mg/2.5 mL (100 mg/mL) carton label for intravenous use only. The label emphasizes dilution prior to use and includes storage instructions between 20° to 25°C. Manufactured for Endo USA and distributed by Premier ProRx, the package contains a single dose vial of 2.5 mL. The label lists key inactive ingredients and cautions to protect from light and avoid freezing.*

* About these descriptions: Image descriptions on this page are generated by automated AI analysis of the product label images from the manufacturer's FDA label submission (SPL). They are provided for reference only and may contain errors or omissions. Always rely on the printed label itself and the official FDA labeling, and consult a pharmacist or healthcare professional with any questions about this product.