Leflunomide Tablet
Product Images NDC 42291-421

8 FDA label images from Avkare · Packaging, Regulatory Labels, and Product Appearance

Product Visual Gallery

This gallery contains 8 technical images submitted to the FDA as part of the official labeling for Leflunomide (NDC 42291-421). Unlike standard consumer photos, these assets often include clinical data figures, molecular chemical structures, and official manufacturer packaging layouts.

As provided by Avkare, these visuals offer a comprehensive scientific overview of the product's physical and chemical identity, aiding pharmacists and researchers in product verification and study.

FDA Label Image

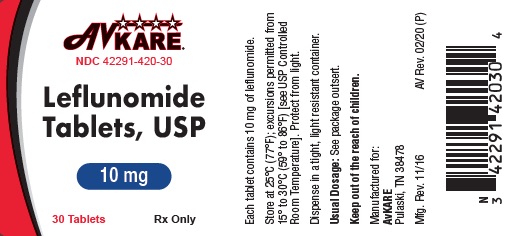
420 30 10mg

420 30 10mg
Leflunomide Tablets USP 10 mg oral tablet label by AvKARE, NDC 42291-420-30. The packaging states "Rx Only" and contains 30 tablets. Storage and usage instructions and a barcode are also visible.*
FDA Label Image

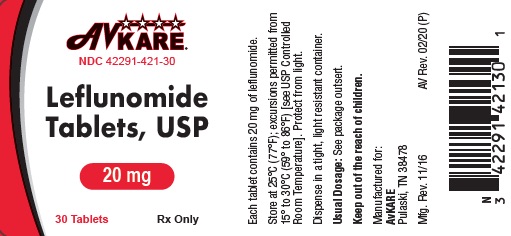
421 30 20mg

421 30 20mg
Packaging label for Leflunomide Tablets, USP with strength of 20 mg, manufactured by AvKARE. The label indicates a package count of 30 tablets and includes storage instructions, usage directions, and safety warnings. The labeler is AvKARE and the label shows an NDC number 42291-421-30.*
FDA Label Image

Figure1.jpg (Figure1)

Figure1.jpg (Figure1)
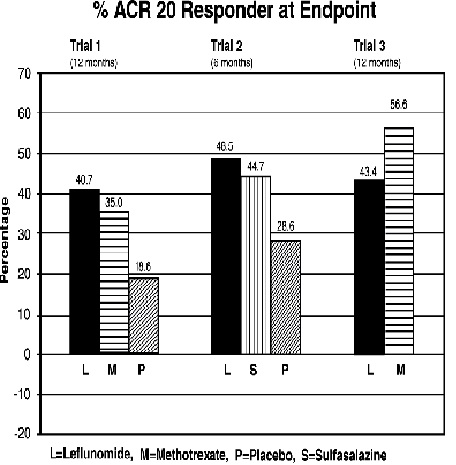
A bar chart titled '% ACR 20 Responder at Endpoint' showing response percentages for three clinical trials of Leflunomide and comparator treatments at different durations (6 or 12 months). The x-axis lists treatments (L=leflunomide, M=methotrexate, P=placebo, S=sulfasalazine), and the y-axis shows percentage values from -20 to 70. Bars represent the percentage of responders for each treatment in each trial.*
FDA Label Image

Figure2.jpg (Figure2)

Figure2.jpg (Figure2)
A line graph titled 'Trial 1 ACR Responders Over Time' showing the percentage of responders over 12 months. The x-axis represents months (0 to 12), and the y-axis represents % responders (from -10 to 70). Three treatments are compared: placebo (PL), methotrexate (MTX), and leflunomide (LEF). Leflunomide shows the highest response percentage over time, followed by methotrexate, and placebo is the lowest. A note indicates 'Last Observation Carried Forward.'*
FDA Label Image

Figure3.jpg (Figure3)

Figure3.jpg (Figure3)
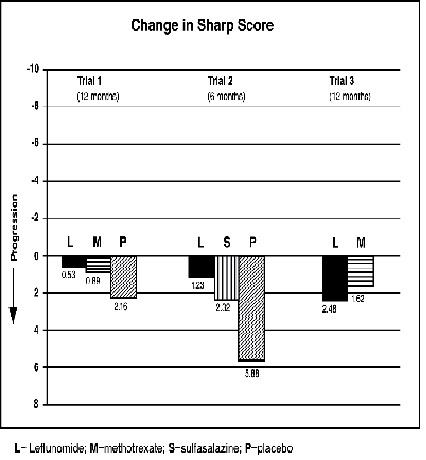
A bar chart titled 'Change in Sharp Score' comparing progression in three clinical trials of 12 or 6 months duration. Bars represent Leflunomide (L), Methotrexate (M), Sulfasalazine (S), and Placebo (P) groups, showing numerical progression values with Leflunomide generally associated with lower progression scores than Placebo and other treatments.*
FDA Label Image

Figure4.jpg (Figure4)

Figure4.jpg (Figure4)
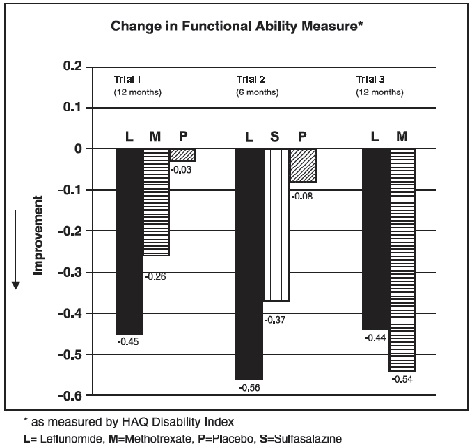
A bar chart titled 'Change in Functional Ability Measure' showing results from three clinical trials over 6 and 12 months. The graph measures improvement on the vertical axis as measured by the HAQ Disability Index. It compares treatments labeled L (Leflunomide), M, P, and S (Sulfasalazine), illustrating varying levels of improvement with Leflunomide generally showing larger decreases indicating greater improvement.*
FDA Label Image

Structure1.jpg (Structure1)

Structure1.jpg (Structure1)
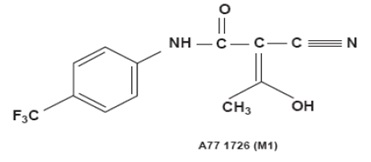
Chemical structure diagram of leflunomide, showing its molecular framework including a trifluoromethyl-substituted phenyl ring connected to an oxazole ring with associated functional groups.*
FDA Label Image

Structure2.jpg (Structure2)

Structure2.jpg (Structure2)
Chemical structure of Leflunomide, showing its molecular arrangement including a trifluoromethyl-substituted phenyl ring and other functional groups consistent with its chemical identity.*

* About these descriptions: Image descriptions on this page are generated by automated AI analysis of the product label images from the manufacturer's FDA label submission (SPL). They are provided for reference only and may contain errors or omissions. Always rely on the printed label itself and the official FDA labeling, and consult a pharmacist or healthcare professional with any questions about this product.