Eplerenone Tablet, Coated
Product Images NDC 42291-454

View Photos of Packaging, Regulatory Labels, and Product Appearance

Product Visual Gallery

This gallery contains 7 technical images submitted to the FDA as part of the official labeling for Eplerenone (NDC 42291-454). Unlike standard consumer photos, these assets often include clinical data figures, molecular chemical structures, and official manufacturer packaging layouts.

As provided by Avkare, these visuals offer a comprehensive scientific overview of the product's physical and chemical identity, aiding pharmacists and researchers in product verification and study.

FDA Label Image

25 (454 90)

25 (454 90)
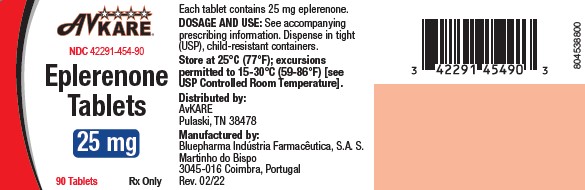
Packaging label for Eplerenone Tablets 25 mg by AvKARE. The label shows the active ingredient strength as 25 mg and the product form as coated tablets. It displays the quantity of 90 tablets, manufacturer as Bluepharma Industria Farmacêutica, Portugal, and distributor AvKARE, Pulaski, TN. Storage instructions at 25°C with permitted excursions are included.*
FDA Label Image

50 (455 90)

50 (455 90)
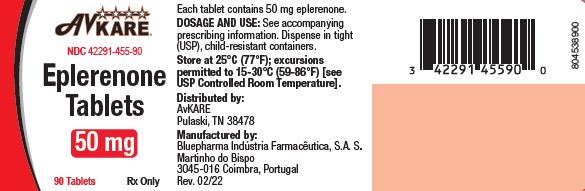
Eplerenone 50 mg coated tablets packaging label by AvKARE. The label shows the proprietary and generic name, strength of 50 mg, and quantity of 90 tablets. It includes storage instructions, distribution by AvKARE (Pulaski, TN), and manufacturing details by Bluepharma Industria Farmacêutica in Portugal. The red and white label features the NDC 42291-455-90 and a barcode.*
FDA Label Image

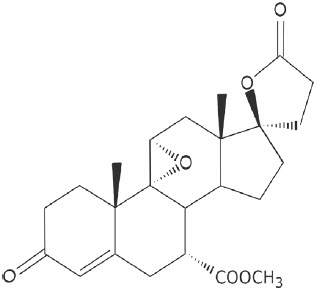
Chemical Structure (Eplerenone 01)

Chemical Structure (Eplerenone 01)
Chemical structure of eplerenone, a steroidal compound depicted with multiple ring systems and functional groups, including ketones and an ester moiety.*
FDA Label Image

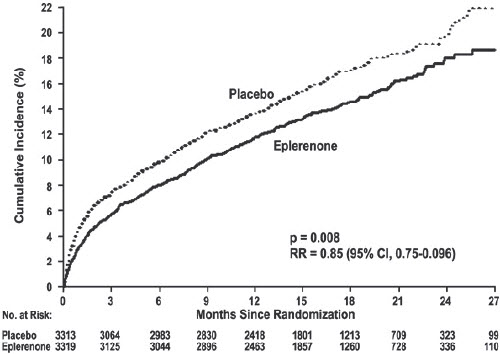
Figure 1 (Eplerenone 02)

Figure 1 (Eplerenone 02)
A line graph showing cumulative incidence (%) over months since randomization for two groups: Eplerenone and Placebo. The Eplerenone group has a lower cumulative incidence compared to Placebo. Numbers at risk are displayed below the x-axis for both groups at multiple time points up to 27 months. Statistical data includes p = 0.008 and relative risk (RR) = 0.85 with 95% confidence interval 0.75–0.96.*
FDA Label Image

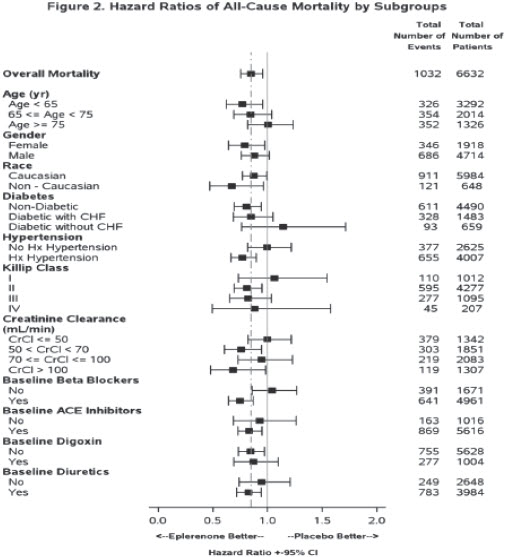
Figure 2 (Eplerenone 03)

Figure 2 (Eplerenone 03)
A forest plot displaying hazard ratios of all-cause mortality by various subgroups for a study comparing Eplerenone with placebo. Subgroups include age, gender, race, diabetes status, hypertension history, Killip class, creatinine clearance levels, baseline use of beta blockers, ACE inhibitors, digoxin, and diuretics. Each subgroup has a hazard ratio with 95% confidence intervals showing relative mortality risk.*
FDA Label Image

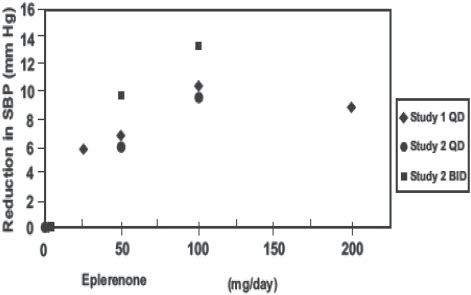
Figure 3 (Eplerenone 04)

Figure 3 (Eplerenone 04)
A scatter plot showing the reduction in systolic blood pressure (SBP) in mm Hg on the vertical axis versus daily eplerenone dose in mg on the horizontal axis. Data points represent results from three studies: Study 1 QD, Study 2 QD, and Study 2 BID, each indicated with different symbols. The chart illustrates varying degrees of SBP reduction across doses ranging from about 25 to 200 mg/day.*
FDA Label Image

Figure 4 (Eplerenone 05)

Figure 4 (Eplerenone 05)
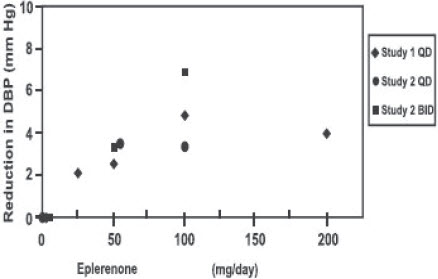
A scatter plot chart depicting the reduction in diastolic blood pressure (DBP) in mm Hg versus daily dosage of Eplerenone (mg/day). Different symbols represent three studies: Study 1, Study 2, and Study 2 BID, showing their respective data points across dosages ranging from 0 to 200 mg/day.*

* About these descriptions: Image descriptions on this page are generated by automated AI analysis of the product label images from the manufacturer's FDA label submission (SPL). They are provided for reference only and may contain errors or omissions. Always rely on the printed label itself and the official FDA labeling, and consult a pharmacist or healthcare professional with any questions about this product.