Terazosin Capsule
Product Images NDC 42291-821

View Photos of Packaging, Regulatory Labels, and Product Appearance

Product Visual Gallery

This gallery contains 8 technical images submitted to the FDA as part of the official labeling for Terazosin (NDC 42291-821). Unlike standard consumer photos, these assets often include clinical data figures, molecular chemical structures, and official manufacturer packaging layouts.

As provided by Avkare, these visuals offer a comprehensive scientific overview of the product's physical and chemical identity, aiding pharmacists and researchers in product verification and study.

FDA Label Image

1mg (820 10 1mg)

1mg (820 10 1mg)
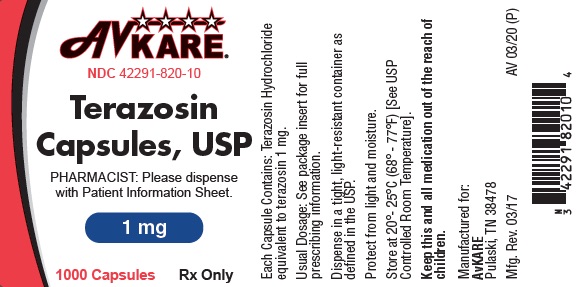
Terazosin is a medication in the form of capsules, primarily used for treating high blood pressure and other conditions, as prescribed by a physician. The drug comes in a bottle of 1000 capsules and is only available by prescription from a pharmacist. The product information sheet must be provided along with the medication.*
FDA Label Image

2mg (821 10 2mg)

FDA Label Image

5mg (822 10 5mg)

FDA Label Image

10mg (823 10 10mg)

10mg (823 10 10mg)
Terazosin Capsules with a strength of 10 mg and NDC 42291-823-10 are available to be dispensed by the pharmacist. The package also contains a patient information sheet.*
FDA Label Image

Terazosin Hydrochloride Chemical Structure (Terazosin Hydrochloride Capsules 1)

FDA Label Image

Figure 1 (Terazosin Hydrochloride Capsules 2)

FDA Label Image

Figure 2 (Terazosin Hydrochloride Capsules 3)

Figure 2 (Terazosin Hydrochloride Capsules 3)
This appears to be a table showing the mean change from baseline at various time points. The time points are labeled as 0, 1, 2, 3, 6, 9, 12, 15, 18, 21, 24, 27 and 30 months. However, there is no other information available to provide context for what the table is measuring.*
FDA Label Image

Figure 3 (Terazosin Hydrochloride Capsules 4)

Figure 3 (Terazosin Hydrochloride Capsules 4)
This appears to be a graph or chart showing changes in "mL/sec" over a period of time, with time intervals marked in months ranging from 0 to 30. However, without any context or additional information, it is difficult to determine what exactly the chart is measuring or why it is significant.*

* These product label images have been analyzed using experimental machine learning. Please verify findings with the primary label text.