Teriflunomide Tablet, Film Coated
Product Images NDC 42291-831

View Photos of Packaging, Regulatory Labels, and Product Appearance

Product Visual Gallery

This gallery contains 5 technical images submitted to the FDA as part of the official labeling for Teriflunomide (NDC 42291-831). Unlike standard consumer photos, these assets often include clinical data figures, molecular chemical structures, and official manufacturer packaging layouts.

As provided by Avkare, these visuals offer a comprehensive scientific overview of the product's physical and chemical identity, aiding pharmacists and researchers in product verification and study.

FDA Label Image

30 (830 30)

30 (830 30)
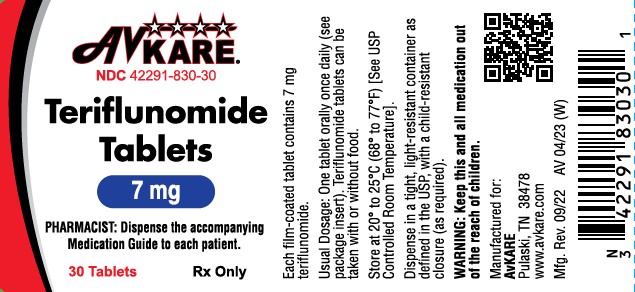
Teriflunomide 7 mg film-coated tablets by AvKARE. The label displays the product name, strength, and form with directions for pharmacists to dispense the medication guide. It indicates 30 tablets per package and includes storage instructions and a warning to keep out of reach of children.*
FDA Label Image

30 (831 30)

30 (831 30)
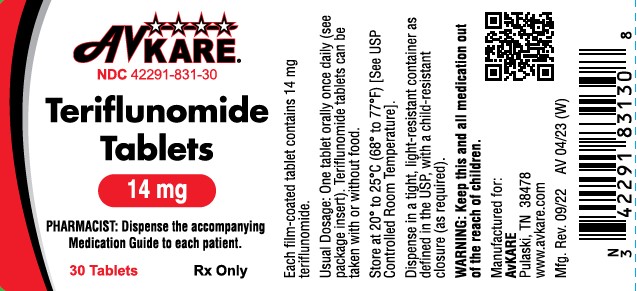
Teriflunomide 14 mg film-coated tablets packaging label. The label shows the AvKARE logo, product name, strength 14 mg, dosage form as tablets, and a pack count of 30 tablets. It includes directions to dispense the accompanying medication guide and states 'Rx Only.' Additional storage and usage instructions are partially visible.*
FDA Label Image

1 (Image 1)

1 (Image 1)
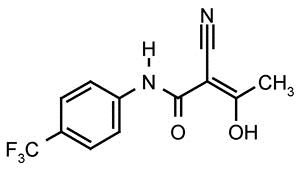
Chemical structure of Teriflunomide, shown as a molecular diagram including carbon, hydrogen, nitrogen, oxygen, and fluorine atoms arranged with a trifluoromethyl group attached to a benzene ring, connected to a side chain with amide and nitrile functional groups.*
FDA Label Image

1 (Image 2)

1 (Image 2)
A Kaplan-Meier plot showing percent disability progression sustained for 12 weeks over 108 weeks comparing placebo, 7 mg Teriflunomide, and 14 mg Teriflunomide. The graph includes lines for each group with percentage values near the end: placebo (27.3%), 7 mg Teriflunomide (21.7%), and 14 mg Teriflunomide (20.2%). The x-axis represents weeks, and the y-axis shows percentage of disability progression. A table below the plot displays the number of subjects at risk for each group at various time points.*
FDA Label Image

1 (Image 3)

1 (Image 3)
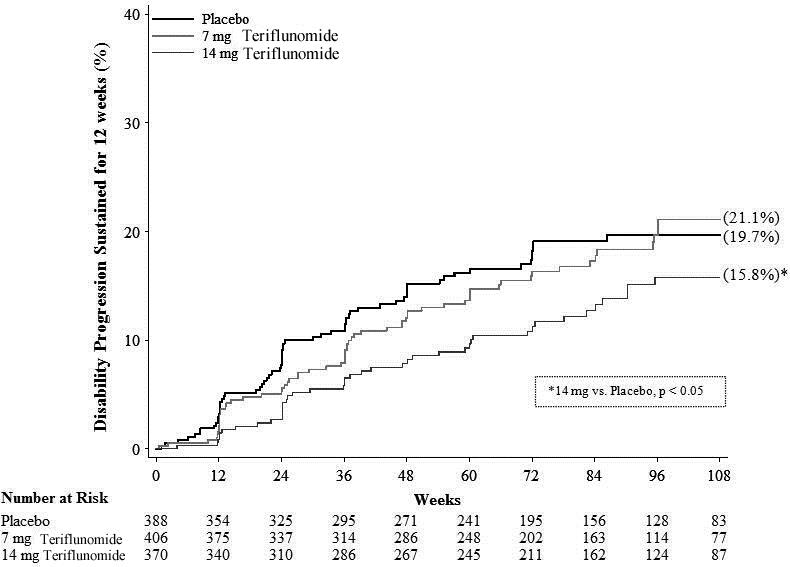
A line graph depicting disability progression sustained for 12 weeks (%) over a timeline of up to 108 weeks comparing Placebo, 7 mg Teriflunomide, and 14 mg Teriflunomide. The graph shows three curves with Placebo having the highest progression, followed by 7 mg and then 14 mg Teriflunomide, which exhibits the lowest progression. The chart also includes a table of the number of patients at risk for each group at different weeks.*

* About these descriptions: Image descriptions on this page are generated by automated AI analysis of the product label images from the manufacturer's FDA label submission (SPL). They are provided for reference only and may contain errors or omissions. Always rely on the printed label itself and the official FDA labeling, and consult a pharmacist or healthcare professional with any questions about this product.