Varenicline Tablet, Film Coated
Product Images NDC 42291-928

View Photos of Packaging, Regulatory Labels, and Product Appearance

Product Visual Gallery

This gallery contains 7 technical images submitted to the FDA as part of the official labeling for Varenicline (NDC 42291-928). Unlike standard consumer photos, these assets often include clinical data figures, molecular chemical structures, and official manufacturer packaging layouts.

As provided by Avkare, these visuals offer a comprehensive scientific overview of the product's physical and chemical identity, aiding pharmacists and researchers in product verification and study.

FDA Label Image

56 (927 56)

56 (927 56)
The label for Varenicline Tablets 0.5 mg by AvKARE displays branding and product information including the NDC 42291-927-56. It states that each tablet contains 0.5 mg varenicline as varenicline tartrate, includes storage instructions, dosage guidance, and manufacturer details for Alkem Laboratories Ltd. The package contains 56 film-coated oral tablets.*
FDA Label Image

56 (928 56)

56 (928 56)
Label for varenicline tablets 1 mg by AvKARE. The film-coated oral tablets come in a 56-count package. The label includes storage instructions, dosage form, manufacturer details, and states prescription status as Rx only.*
FDA Label Image

1 (929 53)

1 (929 53)
Varenicline Tablets Starting Month Box packaging label, containing a 4-week supply with one starting week of 0.5 mg tablets (11 tablets) and three continuing weeks of 1 mg tablets (42 tablets). The film-coated oral tablets are labeled as prescription only and manufactured by or for AvKARE. The label includes dosing instructions and storage conditions.*
FDA Label Image

Var-fig-1 (Var Fig 1)

Var-fig-1 (Var Fig 1)
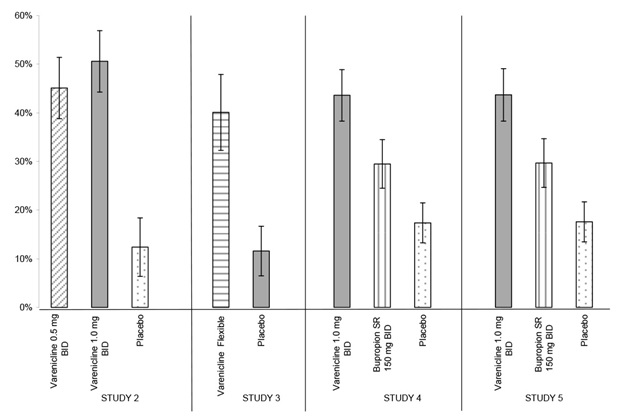
A bar chart presenting comparative data from four clinical studies labeled Study 2, Study 3, Study 4, and Study 5. The chart compares the effects of varenicline at different dosages (0.5 mg BID, 1.0 mg BID, and flexible dosing), bupropion SR 150 mg BID, and placebo. Each study has three bars representing the different treatment groups, with percentages on the vertical axis ranging from 0% to 60%, indicating outcome measures.*
FDA Label Image

Var-fig-2 (Var Fig 2)

Var-fig-2 (Var Fig 2)
A bar chart comparing percentage outcomes across four studies (Study 2, Study 3, Study 4, Study 5) for varenicline doses and placebo, with Study 4 and Study 5 also including bupropion. Each study group is represented by bars with error bars indicating variance.*
FDA Label Image

Var01 (Var01)

Var01 (Var01)
Chemical structure diagram of varenicline tartrate, showing the molecular framework with a bicyclic core and associated tartrate moiety.*
FDA Label Image

Var04 (Var04)

Var04 (Var04)
A line graph comparing the percentage of continuous abstinent subjects over non-treatment follow-up weeks between Varenicline 1.0 mg BID tablets and placebo. The x-axis shows weeks of follow-up, while the y-axis shows the percent continuous abstinent, with Varenicline sustaining higher abstinence rates than placebo throughout the period.*

* About these descriptions: Image descriptions on this page are generated by automated AI analysis of the product label images from the manufacturer's FDA label submission (SPL). They are provided for reference only and may contain errors or omissions. Always rely on the printed label itself and the official FDA labeling, and consult a pharmacist or healthcare professional with any questions about this product.