Zafemy Patch
Product Images NDC 42291-930

View Photos of Packaging, Regulatory Labels, and Product Appearance

Product Visual Gallery

This gallery contains 24 technical images submitted to the FDA as part of the official labeling for Zafemy (NDC 42291-930). Unlike standard consumer photos, these assets often include clinical data figures, molecular chemical structures, and official manufacturer packaging layouts.

As provided by Avkare, these visuals offer a comprehensive scientific overview of the product's physical and chemical identity, aiding pharmacists and researchers in product verification and study.

FDA Label Image

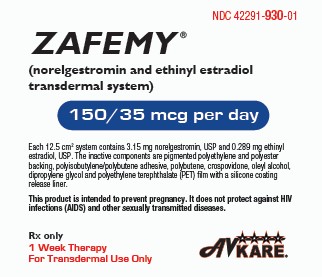
1 (930 01)

1 (930 01)
ZAFEMY 150/35 mcg per day transdermal patch containing norelgestromin and ethinyl estradiol. The label indicates each 12.5 cm2 system delivers 3.15 mg norelgestromin and 0.289 mg ethinyl estradiol. It is labeled for 1 week therapy and transdermal use only. The product is distributed by AvKARE. Warning notes include pregnancy prevention and STD protection disclaimer.*
FDA Label Image

3 (930 03)

3 (930 03)
ZAFEMY 150/35 mcg per day transdermal patch packaging label for norelgestromin and ethinyl estradiol. The label shows dosage strength, dosing instructions, storage conditions, and warnings. Manufactured by AvKARE, the package contains 3 transdermal systems. The label includes a barcode and space for a pharmacy label.*
FDA Label Image

Where To Put Patch (Zafemy Norelgestromin And Ethinyl Estradiol Transd 1)

Where To Put Patch (Zafemy Norelgestromin And Ethinyl Estradiol Transd 1)
Illustrations showing proper application sites for ZAFEMY transdermal patches on various body areas including the upper arm, lower abdomen, buttocks, and upper back. Each image depicts a patch applied to the skin on these recommended locations.*
FDA Label Image

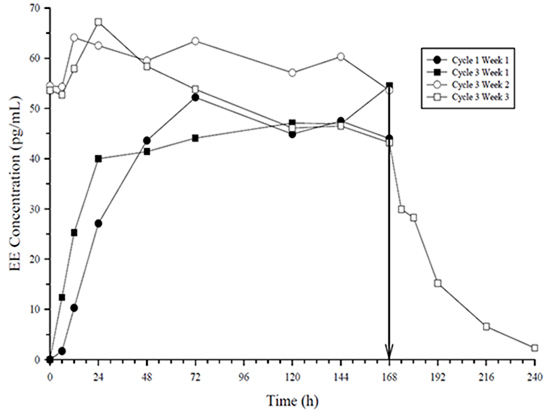
Figure 4 (Zafemy Norelgestromin And Ethinyl Estradiol Transd 10)

Figure 4 (Zafemy Norelgestromin And Ethinyl Estradiol Transd 10)
A line graph depicting Ethinyl Estradiol (EE) concentration in pg/mL over time in hours. The graph shows multiple cycles labeled Cycle 1 Week 1, Cycle 3 Week 1, Cycle 3 Week 2, and Cycle 3 Week 3, with lines representing EE concentration changes across a time span up to 240 hours. An arrow at 168 hours is also shown.*
FDA Label Image

Figure 5 (Zafemy Norelgestromin And Ethinyl Estradiol Transd 11)

Figure 5 (Zafemy Norelgestromin And Ethinyl Estradiol Transd 11)
A line graph comparing Norelgestromin (NGMN) concentration in ng/mL over time in hours. It shows two data sets: ZAFEMY patch applied to the buttock, represented by squares, and an oral contraceptive with NGMN 250 µg and EE 35 µg, represented by circles. The graph illustrates concentration changes from 0 to 240 hours, including estimated steady state data on day 21 for the oral contraceptive.*
FDA Label Image

Figure 6 (Zafemy Norelgestromin And Ethinyl Estradiol Transd 12)

Figure 6 (Zafemy Norelgestromin And Ethinyl Estradiol Transd 12)
A line graph showing EE (Ethinyl Estradiol) concentration in pg/mL over time in hours for ZAFEMY applied to the buttock versus oral contraceptives containing Norelgestromin 250 µg and Ethinyl Estradiol 35 µg. The graph plots concentration changes up to 240 hours, illustrating steady-state data and comparative pharmacokinetic profiles.*
FDA Label Image

01 (Zafemy Norelgestromin And Ethinyl Estradiol Transd 13)

01 (Zafemy Norelgestromin And Ethinyl Estradiol Transd 13)
A vertical chart categorizing pregnancy rates per 100 women in one year alongside contraceptive methods. It ranks methods from fewer pregnancies (below 1 per 100 women) including implants, injectables, intrauterine devices, and sterilization, to more pregnancies (85 or more per 100 women) associated with no birth control. Intermediate groups include birth control pills, skin patches, vaginal rings with hormones, condoms, diaphragms, and behavioral methods like avoiding sex on fertile days, spermicide, and withdrawal.*
FDA Label Image

02 (Zafemy Norelgestromin And Ethinyl Estradiol Transd 14)

02 (Zafemy Norelgestromin And Ethinyl Estradiol Transd 14)
An instructional calendar diagram for a transdermal patch use schedule. It shows three weeks labeled Day 1, Day 8, and Day 15 with arrows indicating continuous use. Week 4 is labeled with a large 'X' and the text 'NO PATCH,' indicating no patch should be applied that week.*
FDA Label Image

03 (Zafemy Norelgestromin And Ethinyl Estradiol Transd 15)

03 (Zafemy Norelgestromin And Ethinyl Estradiol Transd 15)
A horizontal bar graph illustrating the number of women with a blood clot per 10,000 woman-years, categorized by Non-CHC users (non-pregnant), CHC users, pregnant women, and postpartum women (12 weeks only). Each category shows a range with different bar section shading depicting incidence rates, with postpartum women having the highest range from 40 to 65 events.*
FDA Label Image

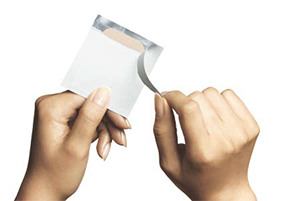
Figure A (Zafemy Norelgestromin And Ethinyl Estradiol Transd 16)

Figure A (Zafemy Norelgestromin And Ethinyl Estradiol Transd 16)
An illustration showing hands peeling back the backing foil from a transdermal patch, demonstrating how to prepare the medication patch for application to the skin.*
FDA Label Image

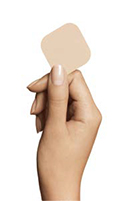
Figure B (Zafemy Norelgestromin And Ethinyl Estradiol Transd 17)

Figure B (Zafemy Norelgestromin And Ethinyl Estradiol Transd 17)
A photograph showing a hand holding a small, square transdermal patch with rounded edges. The patch is beige and appears thin, demonstrating the typical size and appearance of a transdermal drug delivery system.*
FDA Label Image

Where To Put Patch (Zafemy Norelgestromin And Ethinyl Estradiol Transd 18)

Where To Put Patch (Zafemy Norelgestromin And Ethinyl Estradiol Transd 18)
Instructional images demonstrating the application of the ZAFEMY transdermal patch on various body locations including the upper arm, lower abdomen, side of the hip, and upper back/shoulder area. The images show placement and positioning of the patch on skin.*
FDA Label Image

Usage Illustration 1 (Zafemy Norelgestromin And Ethinyl Estradiol Transd 19)

Usage Illustration 1 (Zafemy Norelgestromin And Ethinyl Estradiol Transd 19)
An instructional illustration showing how to apply a ZAFEMY transdermal patch. The image depicts a person holding the patch, with one hand peeling off the protective liner and the other hand preparing to place the patch on the skin. This visual aids proper application technique for the contraceptive patch containing Norelgestromin and Ethinyl Estradiol.*
FDA Label Image

Usage Illustration 1 (Zafemy Norelgestromin And Ethinyl Estradiol Transd 2)

Usage Illustration 1 (Zafemy Norelgestromin And Ethinyl Estradiol Transd 2)
An instructional illustration showing hands peeling a protective backing off a ZAFEMY transdermal patch. The image demonstrates proper handling for applying the adhesive patch containing norelgestromin and ethinyl estradiol for prescription use.*
FDA Label Image

Usage Illustration 2 (Zafemy Norelgestromin And Ethinyl Estradiol Transd 20)

Usage Illustration 2 (Zafemy Norelgestromin And Ethinyl Estradiol Transd 20)
An image showing a close-up of two hands holding a transdermal patch, illustrating the application of a ZAFEMY patch, a combination of Norelgestromin and Ethinyl Estradiol used for hormonal therapy. The hands appear to be preparing or applying the patch to the skin.*
FDA Label Image

Usage Illustration 3 (Zafemy Norelgestromin And Ethinyl Estradiol Transd 21)

Usage Illustration 3 (Zafemy Norelgestromin And Ethinyl Estradiol Transd 21)
An instructional illustration showing the application of a transdermal patch on the lower abdomen. A hand is placing a small rectangular patch onto the skin, demonstrating correct placement for a transdermal drug delivery system.*
FDA Label Image

Usage Illustration 4 (Zafemy Norelgestromin And Ethinyl Estradiol Transd 22)

Usage Illustration 4 (Zafemy Norelgestromin And Ethinyl Estradiol Transd 22)
A close-up image showing a person applying a transdermal patch to the skin on their abdomen. The patch is square-shaped and semi-transparent, demonstrating the typical use of a medication patch applied topically for drug delivery.*
FDA Label Image

Usage Illustration 2 (Zafemy Norelgestromin And Ethinyl Estradiol Transd 3)

Usage Illustration 2 (Zafemy Norelgestromin And Ethinyl Estradiol Transd 3)
An illustration showing a person's hands applying a transdermal patch to the skin, demonstrating proper placement and usage technique for a medication delivery patch.*
FDA Label Image

Usage Illustration 3 (Zafemy Norelgestromin And Ethinyl Estradiol Transd 4)

Usage Illustration 3 (Zafemy Norelgestromin And Ethinyl Estradiol Transd 4)
An instructional illustration showing the application of a transdermal patch to a person's skin, featuring hands placing a small rectangular patch on an exposed area of the body. The image conveys proper patch placement and use.*
FDA Label Image

Usage Illustration 4 (Zafemy Norelgestromin And Ethinyl Estradiol Transd 5)

Usage Illustration 4 (Zafemy Norelgestromin And Ethinyl Estradiol Transd 5)
A close-up illustration of a person's abdomen with a transdermal patch applied to the skin. The hands are visible, gently touching the edges of the patch, indicating the application or presence of a medication patch on the lower abdominal area.*
FDA Label Image

Figure 2 (Zafemy Norelgestromin And Ethinyl Estradiol Transd 6)

Figure 2 (Zafemy Norelgestromin And Ethinyl Estradiol Transd 6)
A horizontal bar chart showing the number of women with a blood clot per 10,000 woman-years across four groups: Non-CHC user non-pregnant, CHC user, pregnant, and postpartum (12 weeks only). Each group bar includes a dark and light section indicating a range of values for clot occurrences.*
FDA Label Image

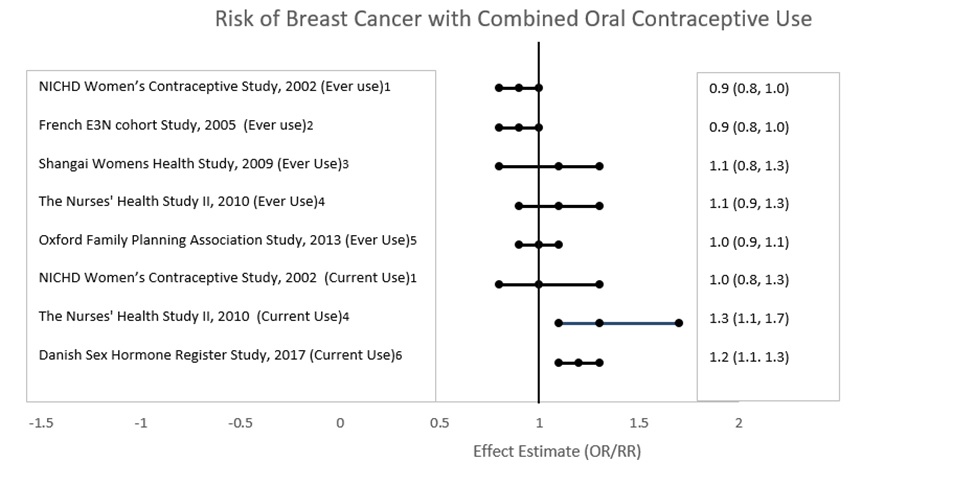
1 (Zafemy Norelgestromin And Ethinyl Estradiol Transd 7)

1 (Zafemy Norelgestromin And Ethinyl Estradiol Transd 7)
A forest plot titled 'Risk of Breast Cancer with Combined Oral Contraceptive Use,' showing effect estimates (OR/RR) from various studies between 2002 and 2017. Studies include both 'Ever Use' and 'Current Use' of combined oral contraceptives, with effect estimates plotted along a horizontal axis ranging from -1.5 to 2.0, highlighting differences in risk estimates and confidence intervals for each study.*
FDA Label Image

Structural Formula (Zafemy Norelgestromin And Ethinyl Estradiol Transd 8)

Structural Formula (Zafemy Norelgestromin And Ethinyl Estradiol Transd 8)
Chemical structures of Norelgestromin and Ethinyl Estradiol, the active ingredients in the ZAFEMY transdermal patch. The diagram shows detailed molecular configurations of these synthetic hormones used in the product.*
FDA Label Image

Figure 3 (Zafemy Norelgestromin And Ethinyl Estradiol Transd 9)

Figure 3 (Zafemy Norelgestromin And Ethinyl Estradiol Transd 9)
A line graph plotting NGMN concentration (ng/mL) over time (hours) across different cycles and weeks: Cycle 1 Week 1, Cycle 3 Week 1, Cycle 3 Week 2, and Cycle 3 Week 3. The graph shows concentration rising after application, peaking, then gradually declining over 240 hours, illustrating pharmacokinetic profiles of Norelgestromin in the body.*

* About these descriptions: Image descriptions on this page are generated by automated AI analysis of the product label images from the manufacturer's FDA label submission (SPL). They are provided for reference only and may contain errors or omissions. Always rely on the printed label itself and the official FDA labeling, and consult a pharmacist or healthcare professional with any questions about this product.