Irbesartan Tablet
Product Images NDC 42291-940

View Photos of Packaging, Regulatory Labels, and Product Appearance

Product Visual Gallery

This gallery contains 6 technical images submitted to the FDA as part of the official labeling for Irbesartan (NDC 42291-940). Unlike standard consumer photos, these assets often include clinical data figures, molecular chemical structures, and official manufacturer packaging layouts.

As provided by Avkare, these visuals offer a comprehensive scientific overview of the product's physical and chemical identity, aiding pharmacists and researchers in product verification and study.

FDA Label Image

90 (940 90)

90 (940 90)
IRBESARTAN Tablets USP 75 mg oral tablet package label from AvKARE. The label indicates 90 tablets in the package with Rx only status. It includes prescribing information, dosing instructions, storage conditions, and a barcode on the right side.*
FDA Label Image

90 (941 90)

90 (941 90)
IRBESARTAN Tablets USP 150 mg oral tablet package label by AvKARE. The label shows the NDC number 42291-941-90, quantity of 90 tablets, and indicates Rx only. It includes dosage information and storage instructions, with a barcode and QR code on the right side.*
FDA Label Image

90 (942 90)

90 (942 90)
The label for IRBESARTAN Tablets, USP shows a 300 mg oral tablet strength in a package containing 90 tablets. The label includes the AvKARE logo, NDC number 42291-942-90, and usage instructions stating the medication is prescription only.*
FDA Label Image

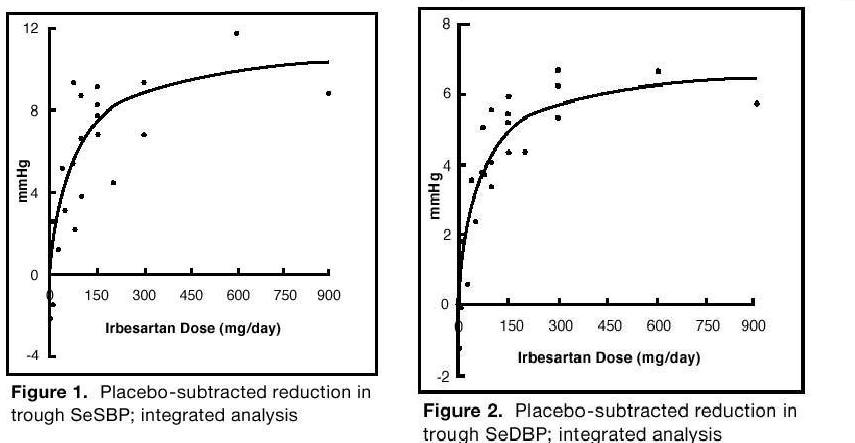
Figure1 (Fig1)

Figure1 (Fig1)
Two dose-response graphs showing the placebo-subtracted reduction in systolic and diastolic blood pressure (SeSBP and SeDBP) in mmHg versus Irbesartan dose in mg/day. The left graph (Figure 1) plots reduction in trough SeSBP and the right graph (Figure 2) plots reduction in trough SeDBP, both depicting an integrated analysis with dose-response curves leveling off at higher doses.*
FDA Label Image

Figure3 (Figure3)

Figure3 (Figure3)
A Kaplan-Meier cumulative event rate graph comparing Irbesartan, Amlodipine, and Placebo over approximately 58 months of follow-up. The y-axis represents cumulative event rate percentages, while the x-axis shows months of follow-up. The plot includes a legend with relative risk (RR) and p-values for comparisons: Irbesartan vs. Placebo and Irbesartan vs. Amlodipine.*
FDA Label Image

Structure (Structure)

Structure (Structure)
Chemical structure diagram of irbesartan, showing its molecular framework including cyclopentane, imidazole, and biphenyl groups.*

* About these descriptions: Image descriptions on this page are generated by automated AI analysis of the product label images from the manufacturer's FDA label submission (SPL). They are provided for reference only and may contain errors or omissions. Always rely on the printed label itself and the official FDA labeling, and consult a pharmacist or healthcare professional with any questions about this product.