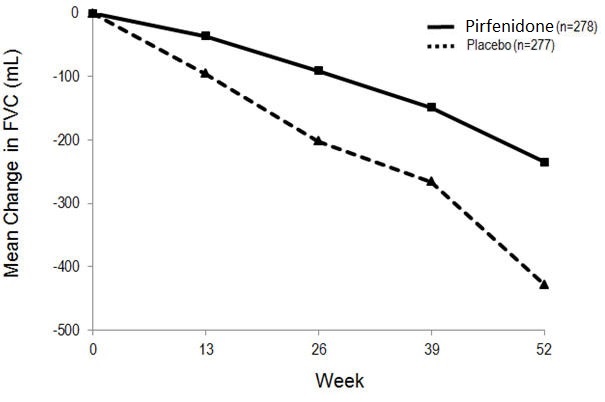
Pirfenidone Figure 1 (Pirfenidone Figure1)

This appears to be a statistical chart showing the percentage of patients who experienced worsening, no change or improvement in their forced vital capacity (FVC) as a result of taking Pirfenidone compared to a placebo. The chart also shows the absolute change in FVC percentage from baseline to 52 weeks.*