Nabumetone 500 mg Fig 1 Image (Nabumetone 500 mg Fig 1)
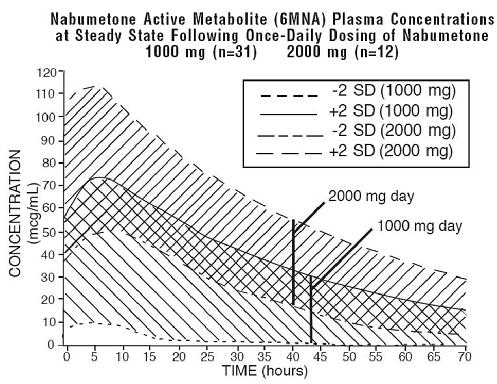
This appears to be a graph or chart regarding the concentration of the active metabolite of Nabumetone in plasma at steady state after once-daily doses of either 1000mg or 2000mg. The concentrations are measured in meg/mL. The chart shows mean concentrations as well as the upper and lower standard deviation at various timepoints up to 20 hours after dosing. There are also percentages listed next to each timepoint, which may represent the proportion of participants with concentrations within a certain range.*