Tramadol Hydrochloride
Product Images NDC 42549-527

4 FDA label images from Stat Rx Usa Llc · Packaging, Regulatory Labels, and Product Appearance

Product Visual Gallery

This gallery contains 4 technical images submitted to the FDA as part of the official labeling for Tramadol Hydrochloride (NDC 42549-527). Unlike standard consumer photos, these assets often include clinical data figures, molecular chemical structures, and official manufacturer packaging layouts.

As provided by Stat Rx Usa Llc, these visuals offer a comprehensive scientific overview of the product's physical and chemical identity, aiding pharmacists and researchers in product verification and study.

FDA Label Image

Tramadol 50mg Label Image (Tramadol 50mg Label 42549)
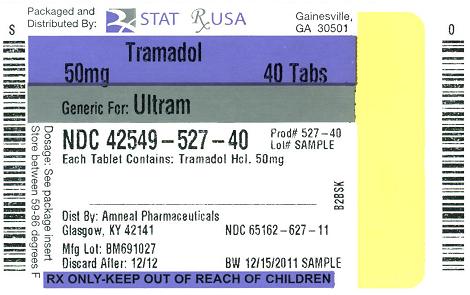
Tramadol 50mg Label Image (Tramadol 50mg Label 42549)
Label for Tramadol Hydrochloride 50 mg tablets, 40 count, distributed by STAT Rx USA LLC. The label states the product is generic for Ultram and includes NDC 42549-527-40. The label also notes manufacture by BMS with additional distribution and discard information, and includes warnings to keep out of reach of children.*
FDA Label Image

2fd4ba08-figure-01 (Tramadol HCl 1)

2fd4ba08-figure-01 (Tramadol HCl 1)
Chemical structure of tramadol hydrochloride showing its molecular arrangement with hydroxyl, dimethylamino, methoxyphenyl, and hydrochloride components.*
FDA Label Image

2fd4ba08-figure-02 (Tramadol HCl 2)

2fd4ba08-figure-02 (Tramadol HCl 2)
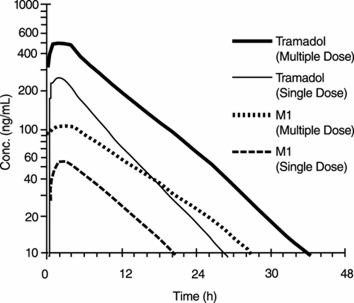
A pharmacokinetic curve showing plasma concentration (ng/mL) of Tramadol and its metabolite M1 over time (hours). The graph compares multiple-dose and single-dose administration of Tramadol Hydrochloride, with distinct lines representing each condition and compound concentration decline over 48 hours.*
FDA Label Image

2fd4ba08-figure-03 (Tramadol HCl 3)

2fd4ba08-figure-03 (Tramadol HCl 3)
A line graph titled 'Protocol CAPSS-047 Time to Discontinuation Due to Nausea/Vomiting' showing percent discontinuing over days in a double-blind study for a treatment of 10 days to 200 mg/day. The y-axis represents percent discontinuing from 0 to 50%, and the x-axis shows days in double-blind from 0 to 25 days. The graph depicts a stair-step increase in discontinuation percent over time.*

* About these descriptions: Image descriptions on this page are generated by automated AI analysis of the product label images from the manufacturer's FDA label submission (SPL). They are provided for reference only and may contain errors or omissions. Always rely on the printed label itself and the official FDA labeling, and consult a pharmacist or healthcare professional with any questions about this product.