Tizanidine Hydrochloride
Product Images NDC 42549-597

6 FDA label images from Stat Rx Usa Llc · Packaging, Regulatory Labels, and Product Appearance

Product Visual Gallery

This gallery contains 6 technical images submitted to the FDA as part of the official labeling for Tizanidine Hydrochloride (NDC 42549-597). Unlike standard consumer photos, these assets often include clinical data figures, molecular chemical structures, and official manufacturer packaging layouts.

As provided by Stat Rx Usa Llc, these visuals offer a comprehensive scientific overview of the product's physical and chemical identity, aiding pharmacists and researchers in product verification and study.

FDA Label Image

Principal Display Paneltizanidine 2mg, 28 Tablets (Tizanidine 2 mg Label 42549)
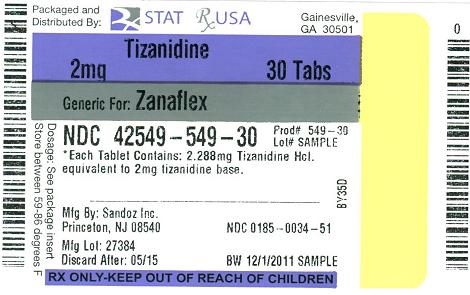
Principal Display Paneltizanidine 2mg, 28 Tablets (Tizanidine 2 mg Label 42549)
Label for tizanidine hydrochloride 2 mg tablets, 30 count. The label indicates it is generic for Zanaflex and is packaged and distributed by STAT Rx USA LLC in Gainesville, GA. The product is manufactured by Sandoz Inc., Princeton, NJ. The label includes an NDC number 42549-549-30 and states each tablet contains 2.288 mg tizanidine HCl, equivalent to 2 mg tizanidine base.*
FDA Label Image

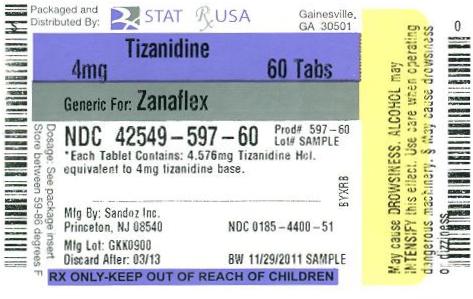
Principal Display Paneltizanidine 4mg, 28 Tablets (Tizanidine 4 mg Label 42549)

Principal Display Paneltizanidine 4mg, 28 Tablets (Tizanidine 4 mg Label 42549)
Label for tizanidine hydrochloride 4mg tablets, 60 count, packaged and distributed by STAT Rx USA LLC, Gainesville, GA. The label indicates the product is generic for Zanaflex and includes the NDC number 42549-597-60. It states each tablet contains 4.576mg tizanidine HCl equivalent to 4mg tizanidine base. Manufactured by Sandoz Inc., Princeton, NJ. The label also includes warnings about drowsiness and alcohol use, with a note to keep out of reach of children.*
FDA Label Image

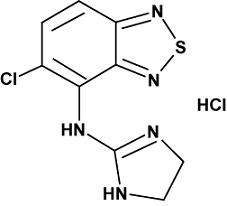
Chemical Structure (Tizanidine Chem Structure)

Chemical Structure (Tizanidine Chem Structure)
Chemical structure of tizanidine hydrochloride showing its molecular arrangement including chlorine, nitrogen, sulfur atoms and hydrogen chloride component.*
FDA Label Image

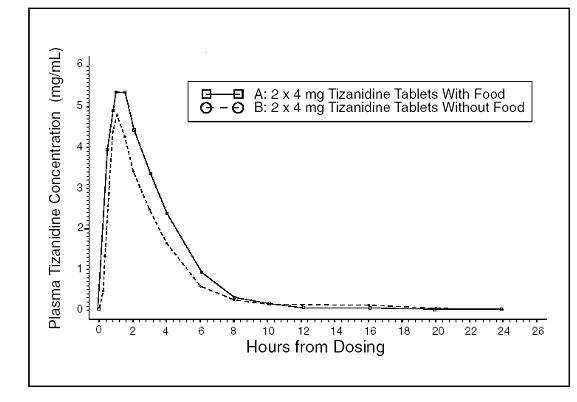
Figure 1 (Tizanidine 2)

Figure 1 (Tizanidine 2)
A line graph showing plasma tizanidine concentration (mg/mL) over 24 hours following dosing. It compares the concentration profiles of 2 x 4 mg tizanidine tablets taken with food versus without food, illustrating absorption and elimination trends over time post-dosing.*
FDA Label Image

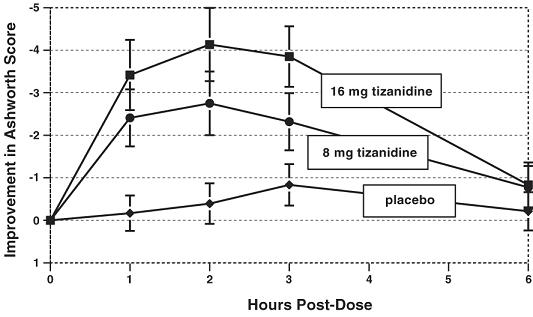
Figure 2 (Tizanidine 3)

Figure 2 (Tizanidine 3)
A line graph showing the improvement in Ashworth Score over 6 hours post-dose for three groups: 16 mg tizanidine, 8 mg tizanidine, and placebo. The vertical axis measures improvement, and the horizontal axis shows time in hours post-dose, with error bars displayed for each data point.*
FDA Label Image

Figure 3 (Tizanidine 4)

Figure 3 (Tizanidine 4)
A graph comparing the improvement in Ashworth Score between tizanidine (mean dose 28.8 mg) and placebo at three time points: End of Titration (Study Week 3), End of Maintenance (Study Week 7), and Endpoint (Last Observation Carried Forward). The vertical axis represents improvement in Ashworth Score, with tizanidine showing notable improvement at all time points compared to placebo.*

* About these descriptions: Image descriptions on this page are generated by automated AI analysis of the product label images from the manufacturer's FDA label submission (SPL). They are provided for reference only and may contain errors or omissions. Always rely on the printed label itself and the official FDA labeling, and consult a pharmacist or healthcare professional with any questions about this product.