Flector
Product Images NDC 42549-606

7 FDA label images from Stat Rx Usa Llc · Packaging, Regulatory Labels, and Product Appearance

Product Visual Gallery

This gallery contains 7 technical images submitted to the FDA as part of the official labeling for Flector (NDC 42549-606). Unlike standard consumer photos, these assets often include clinical data figures, molecular chemical structures, and official manufacturer packaging layouts.

As provided by Stat Rx Usa Llc, these visuals offer a comprehensive scientific overview of the product's physical and chemical identity, aiding pharmacists and researchers in product verification and study.

FDA Label Image

Flector Patch Label Image (Flector Patch 42549)

Flector Patch Label Image (Flector Patch 42549)
Flector 1.3% adhesive patches, 30 count, packaged and distributed by STAT Rx USA LLC. Each patch contains Diclofenac as the active ingredient. Manufactured by Alpharma Pharm. LLC in Piscataway, NJ, labeled with NDC 42549-606-30. The label includes lot and sample details and a federal caution about prescription use.*

FDA Label Image

Flector Patch Rx Only (Flector Patch 1)

Flector Patch Rx Only (Flector Patch 1)
Flector Patch (diclofenac epolamine topical patch) 1.3% label showing the proprietary name, active ingredient, concentration, and Rx Only status. The label includes the STAT Rx USA LLC as the labeler.*
FDA Label Image

Diclofenac Epolamine Structure (Flector Patch 2)

Diclofenac Epolamine Structure (Flector Patch 2)
Chemical structure of diclofenac epolamine, showing the molecular components including the dichlorophenyl group, amine linkage, and the epolamine moiety with its 2-(pyrrolidin-1-yl)ethanol structure.*
FDA Label Image

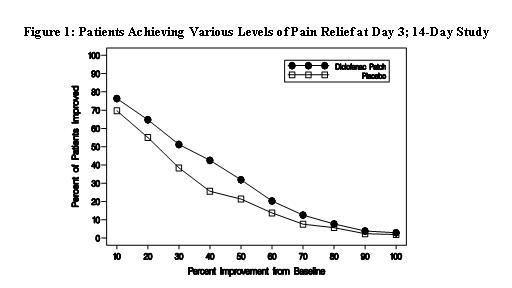
Figure 1 (Flector Patch 3)

Figure 1 (Flector Patch 3)
A line graph depicting the percentage of patients achieving various levels of pain relief by Day 3 in a 14-day study. The x-axis shows percent improvement from baseline, while the y-axis shows percent of patients improved. Two lines compare Diclofenac Patch and Placebo outcomes.*
FDA Label Image

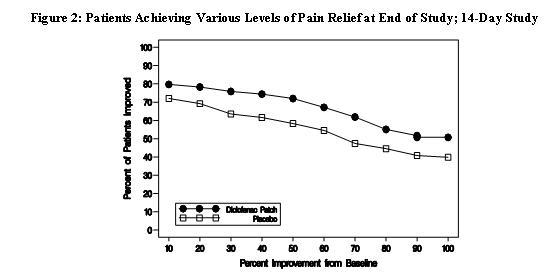
Figure 2 (Flector Patch 4)

Figure 2 (Flector Patch 4)
A line graph depicting the percentage of patients achieving various levels of pain relief at the end of a 14-day study with Flector (diclofenac) patch compared to placebo. The x-axis represents percent improvement from baseline, and the y-axis shows the percent of patients improved, with separate lines for the diclofenac patch and placebo.*
FDA Label Image

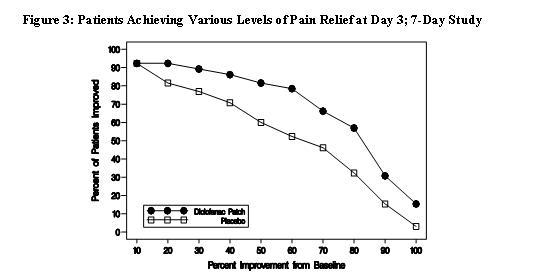
Figure 3 (Flector Patch 5)

Figure 3 (Flector Patch 5)
A line graph titled 'Patients Achieving Various Levels of Pain Relief at Day 3; 7-Day Study' comparing percent improvement from baseline with percent of patients improved. The graph shows two lines, one representing Diclofenac Patch and the other Placebo, over a range of percent improvement values from 10 to 100 on the x-axis, and percent of patients improved from 0 to 100 on the y-axis.*
FDA Label Image

Figure 4 (Flector Patch 6)

Figure 4 (Flector Patch 6)
A line chart titled 'Patients Achieving Various Levels of Pain Relief at End of Study; 7-Day Study.' It shows percent of patients improved versus percent improvement from baseline, comparing Diclofenac Patch and placebo groups.*

* About these descriptions: Image descriptions on this page are generated by automated AI analysis of the product label images from the manufacturer's FDA label submission (SPL). They are provided for reference only and may contain errors or omissions. Always rely on the printed label itself and the official FDA labeling, and consult a pharmacist or healthcare professional with any questions about this product.