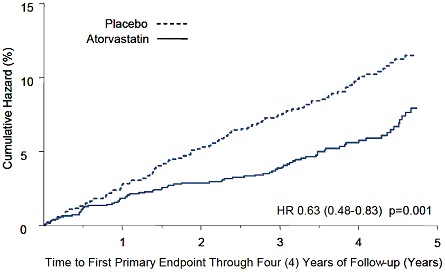
Fig 1 (Atorvastatinfig1)
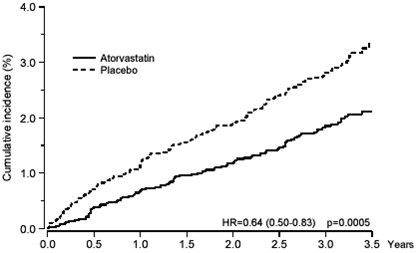
The given text represents a graph or chart showing the cumulative incidence percentage of Atorvastatin and Placebo. The horizontal axis denotes the years while the vertical axis represnts the cumulative incidence in %. Atorvastatin is a more effective medicine as compared to Placebo since the former has a lower cumulative incidence percentage than the latter. The text also includes the hazard ratio (HR) and p-value for the comparison between the two, which suggests a statistically significant difference in efficacy.*