Ticagrelor Tablet, Film Coated
Product Images NDC 42571-263

21 FDA label images from Micro Labs Limited · Packaging, Regulatory Labels, and Product Appearance

Product Visual Gallery

This gallery contains 21 technical images submitted to the FDA as part of the official labeling for Ticagrelor (NDC 42571-263). Unlike standard consumer photos, these assets often include clinical data figures, molecular chemical structures, and official manufacturer packaging layouts.

As provided by Micro Labs Limited, these visuals offer a comprehensive scientific overview of the product's physical and chemical identity, aiding pharmacists and researchers in product verification and study.

FDA Label Image

Ticagrelor-fig1.jpg (Ticagrelor Fig1)
Ticagrelor-fig1.jpg (Ticagrelor Fig1)
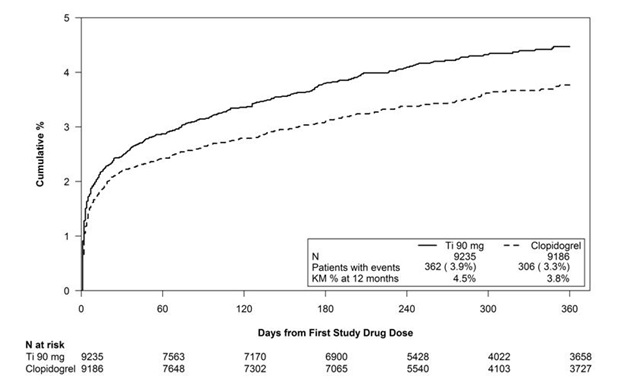
A cumulative percentage line graph comparing two treatments, Ti 90 mg and Clopidogrel, over 360 days from the first study drug dose. The y-axis represents cumulative percentage up to 5%, and the graph shows event incidence over time with Ti 90 mg consistently above Clopidogrel. A data table within the graph details patient numbers and event percentages for each treatment.*
FDA Label Image

Ticagrelor-fig2.jpg (Ticagrelor Fig2)

Ticagrelor-fig2.jpg (Ticagrelor Fig2)
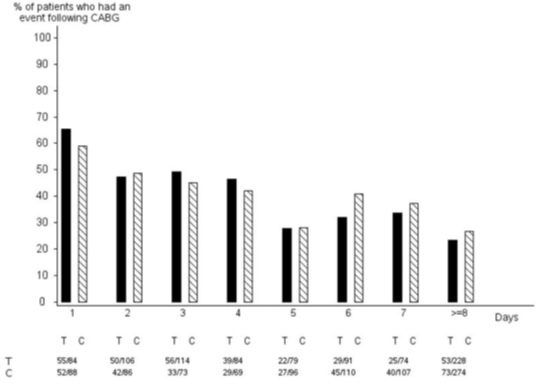
A bar chart comparing the percentage of patients who had an event following CABG over several days. The chart shows two groups labeled T and C, with percentages on the y-axis and days on the x-axis, from day 1 through 8 and beyond. A data table below the chart provides counts of events and total patients for each group and day.*
FDA Label Image

Ticagrelor-fig3.jpg (Ticagrelor Fig3)

Ticagrelor-fig3.jpg (Ticagrelor Fig3)
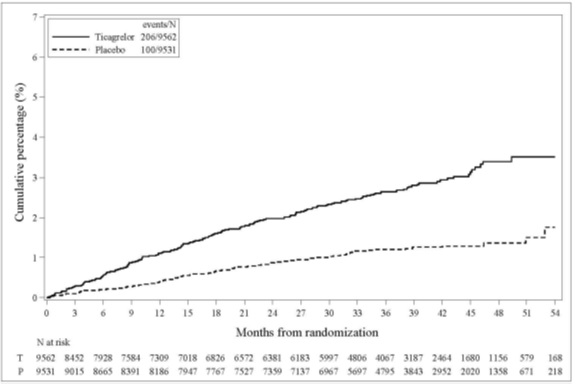
A line graph depicting the cumulative percentage over months from randomization comparing Ticagrelor and placebo groups. The x-axis shows months from randomization (0 to about 54), and the y-axis shows cumulative percentage (0% to 7%). Two lines represent Ticagrelor (solid line) with higher cumulative percentage than placebo (dashed line). A legend indicates event counts: Ticagrelor group 206 events out of 9562 participants, placebo group 100 events out of 9531 participants.*
FDA Label Image

Ticagrelor-fig4.jpg (Ticagrelor Fig4)

Ticagrelor-fig4.jpg (Ticagrelor Fig4)
A Kaplan-Meier cumulative percentage curve comparing the events over days from randomization for Ticagrelor 90 mg twice daily versus placebo. The solid line represents Ticagrelor and the dashed line represents placebo, with the number of subjects at risk indicated below the x-axis along time points up to 30 days.*
FDA Label Image

Ticagrelor-str.jpg (Ticagrelor Str)

Ticagrelor-str.jpg (Ticagrelor Str)
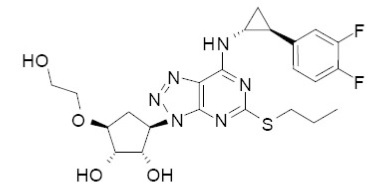
Chemical structure of Ticagrelor, the active ingredient in the prescription drug TICAGRELOR. The diagram shows the molecular arrangement of atoms including hydroxyl groups, fluorinated phenyl rings, and a thiazole ring system.*
FDA Label Image

Ticagrelor-fig5.jpg (Ticagrelor Fig5)

Ticagrelor-fig5.jpg (Ticagrelor Fig5)
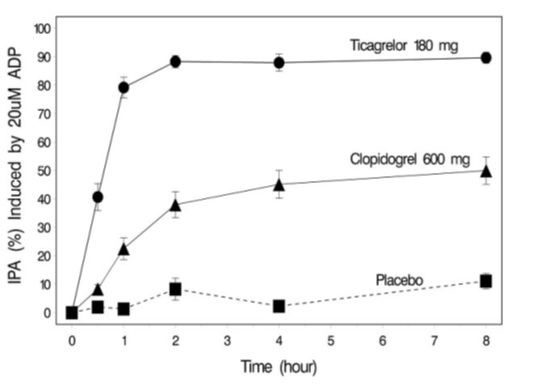
A line graph comparing the inhibitory platelet aggregation (IPA) percentages induced by 20uM ADP over an 8-hour period for Ticagrelor 180 mg, Clopidogrel 600 mg, and Placebo. Ticagrelor shows a rapid increase reaching about 90% inhibition, Clopidogrel shows a moderate increase peaking around 50%, and Placebo remains low throughout.*
FDA Label Image

Ticagrelor-fig6.jpg (Ticagrelor Fig6)

Ticagrelor-fig6.jpg (Ticagrelor Fig6)
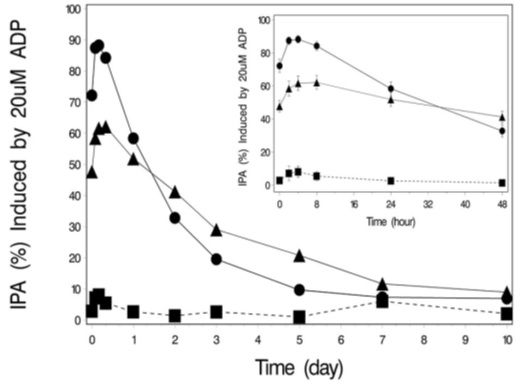
A line chart showing IPA (%) induced by 20μM ADP over time in days on the x-axis. The chart includes multiple data series plotted with different symbols, depicting their IPA (%) changes from day 0 to day 10, with an inset displaying a similar plot over hours. This graph illustrates changes in IPA (%) over time.*
FDA Label Image

Ticagrelor-fig7.jpg (Ticagrelor Fig7)

Ticagrelor-fig7.jpg (Ticagrelor Fig7)
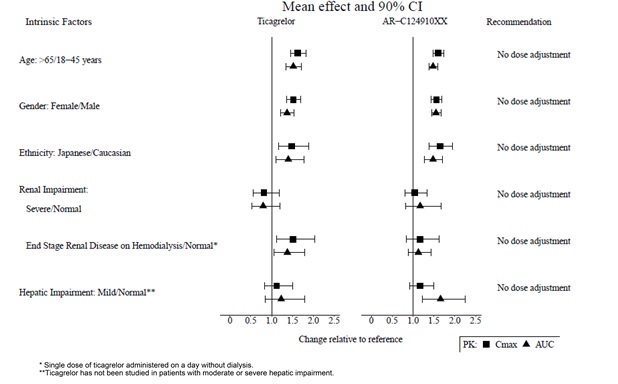
A comparative chart titled 'Mean effect and 90% CI' for Ticagrelor showing pharmacokinetic parameters (Cmax and AUC) relative to reference in various intrinsic factors such as age, gender, ethnicity, renal impairment, end stage renal disease on hemodialysis, and hepatic impairment. Recommendations for all listed factors indicate no dose adjustment is needed.*
FDA Label Image

Ticagrelor-fig8.jpg (Ticagrelor Fig8)

Ticagrelor-fig8.jpg (Ticagrelor Fig8)
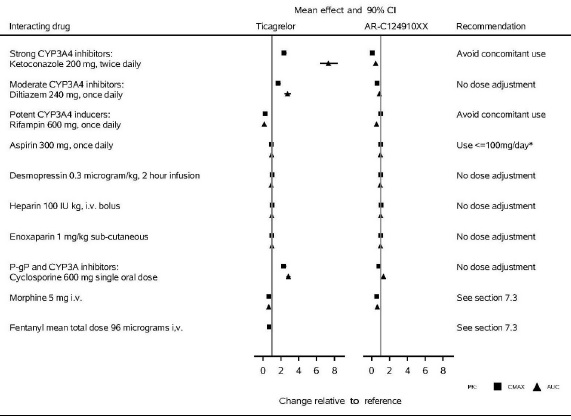
A chart showing the mean effect and 90% confidence interval for ticagrelor interactions with various drugs, including strong to moderate CYP3A4 inhibitors, aspirin, desmopressin, heparin, enoxaparin, cyclosporine, morphine, and fentanyl. It includes recommendations for each interaction, such as avoiding concomitant use or no dose adjustment needed, and references to specific sections for more details.*
FDA Label Image

Ticagrelor-fig9.jpg (Ticagrelor Fig9)

Ticagrelor-fig9.jpg (Ticagrelor Fig9)
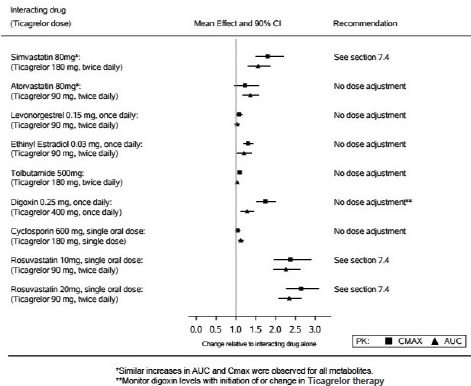
A forest plot chart titled 'Interacting drug (Ticagrelor dose)' showing mean effect and 90% confidence intervals (CI) for various drugs interacting with ticagrelor at specified doses. The chart includes recommendations regarding dose adjustments or monitoring for each interacting drug.*
FDA Label Image

Ticagrelor-fig10.jpg (Ticagrelor Fig10)

Ticagrelor-fig10.jpg (Ticagrelor Fig10)
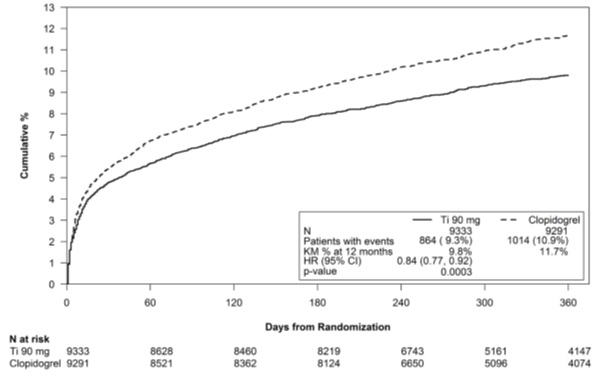
A cumulative percentage line graph comparing TICAGRELOR 90 mg and Clopidogrel treatment groups over 360 days from randomization. The x-axis represents days, and the y-axis shows cumulative percentage of patients with events. The graph includes a legend and statistical data including patient numbers, event percentages, hazard ratio with confidence intervals, and p-value.*
FDA Label Image

Ticagrelor-fig11.jpg (Ticagrelor Fig11)

Ticagrelor-fig11.jpg (Ticagrelor Fig11)
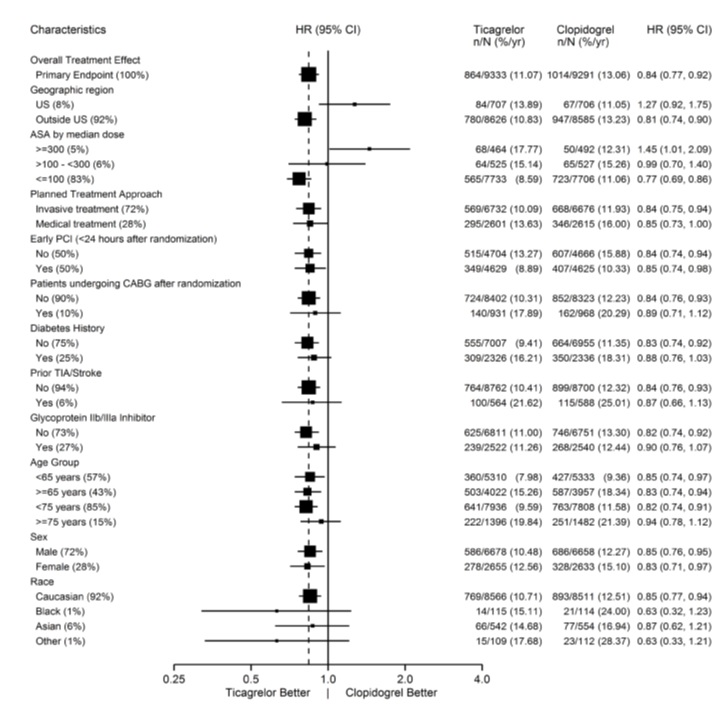
A forest plot chart depicting hazard ratios (HR) and 95% confidence intervals (CI) comparing Ticagrelor versus Clopidogrel treatment effects across various patient characteristics such as geographic region, ASA dose, treatment approach, diabetes history, age groups, sex, and race. The chart includes event rates for each group alongside HR values, illustrating Ticagrelor's relative efficacy and safety compared to Clopidogrel.*
FDA Label Image

Ticagrelor-fig12.jpg (Ticagrelor Fig12)

Ticagrelor-fig12.jpg (Ticagrelor Fig12)
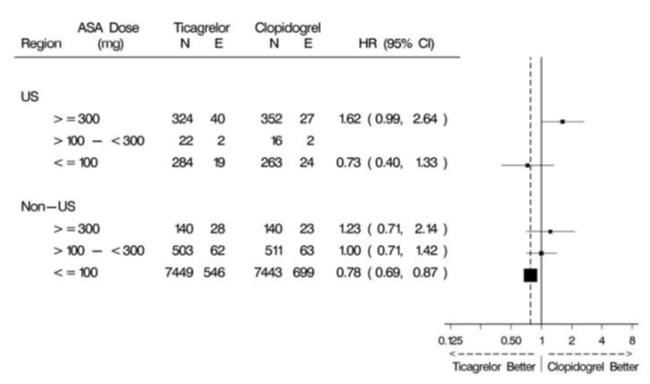
A forest plot chart comparing the hazard ratios (HR) with 95% confidence intervals for Ticagrelor versus Clopidogrel across different ASA dose groups (<=100 mg, >100 to <300 mg, >=300 mg) in US and non-US regions. The plot visually represents treatment effects and confidence intervals for these subgroups.*
FDA Label Image

Ticagrelor-fig13.jpg (Ticagrelor Fig13)

Ticagrelor-fig13.jpg (Ticagrelor Fig13)
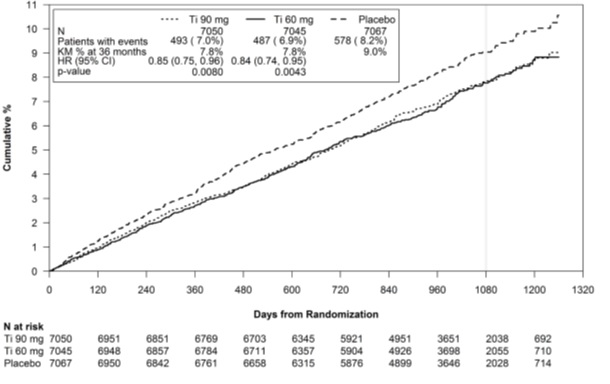
A cumulative percentage line graph showing event rates over days from randomization for three groups: Ticagrelor 90 mg, Ticagrelor 60 mg, and placebo. The graph includes patient counts, Kaplan-Meier estimates at 36 months, hazard ratios with 95% confidence intervals, and p-values for each group comparison. The x-axis represents days from randomization, and the y-axis shows cumulative percentage of events.*
FDA Label Image

Ticagrelor-fig14.jpg (Ticagrelor Fig14)

Ticagrelor-fig14.jpg (Ticagrelor Fig14)
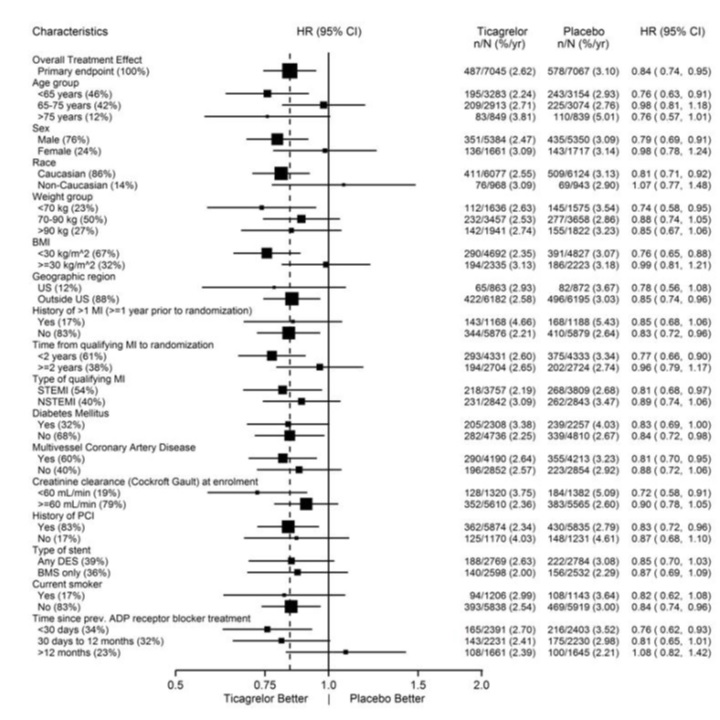
A forest plot chart presenting hazard ratios (HR) with 95% confidence intervals (CI) comparing Ticagrelor versus placebo across multiple patient characteristics such as age group, sex, race, weight, BMI, geographic region, medical history, type of qualifying myocardial infarction, diabetes status, coronary artery disease, creatinine clearance, PCI history, stent type, smoking status, and previous ADP receptor blocker treatment. The x-axis ranges from Ticagrelor better (0.5) to placebo better (2.0), indicating treatment effect on outcomes.*
FDA Label Image

Ticagrelor-fig15.jpg (Ticagrelor Fig15)

Ticagrelor-fig15.jpg (Ticagrelor Fig15)
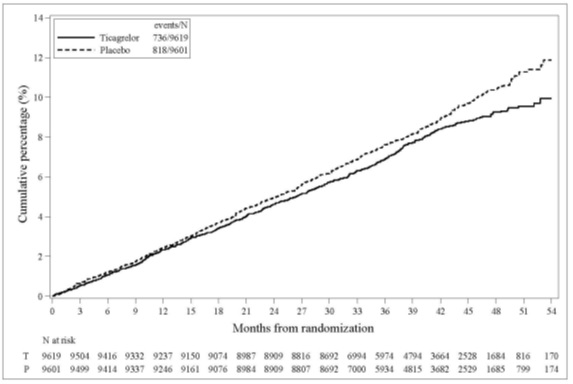
A cumulative percentage line graph comparing Ticagrelor and placebo over 54 months from randomization. The x-axis represents months, and the y-axis shows cumulative percentage events. Ticagrelor is depicted with a solid line, and placebo with a dashed line, with slightly higher cumulative events for placebo.*
FDA Label Image

Ticagrelor-fig16.jpg (Ticagrelor Fig16)

Ticagrelor-fig16.jpg (Ticagrelor Fig16)
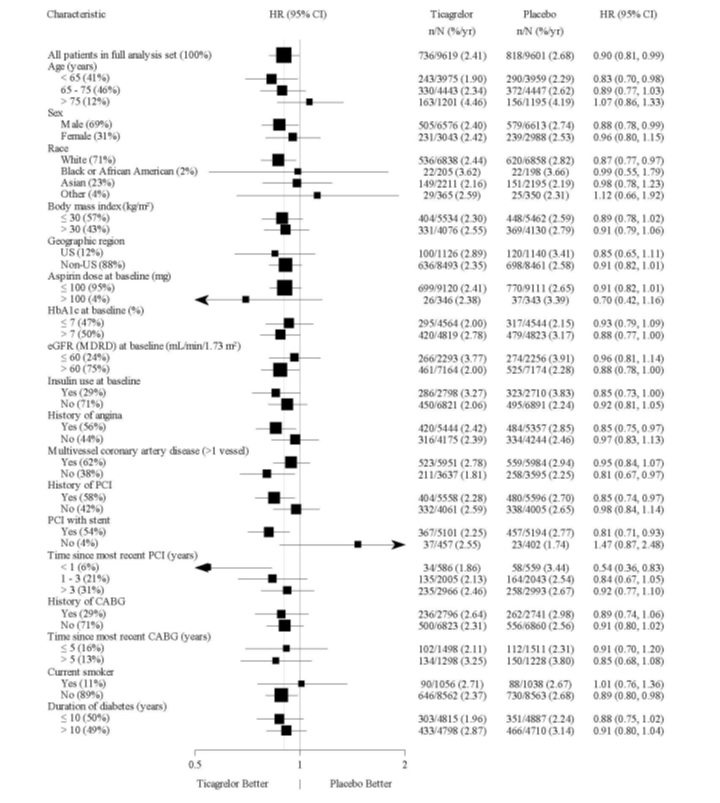
A forest plot comparing hazard ratios (HR) and 95% confidence intervals for various characteristics between Ticagrelor and placebo groups in a clinical analysis. The chart includes patient subgroups by age, sex, race, body mass index, geographic region, aspirin dose, baseline HbA1c, eGFR, insulin use, history of angina, multivessel coronary artery disease, PCI history, time since recent PCI, history of CABG, smoking status, and diabetes duration. The plot visually displays HR values indicating relative effectiveness or outcomes for Ticagrelor versus placebo.*
FDA Label Image

Ticagrelor-fig17.jpg (Ticagrelor Fig17)

Ticagrelor-fig17.jpg (Ticagrelor Fig17)
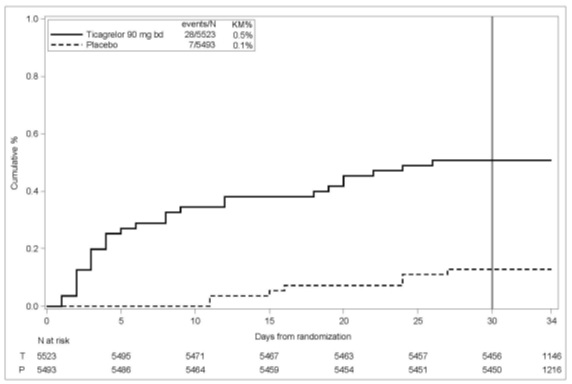
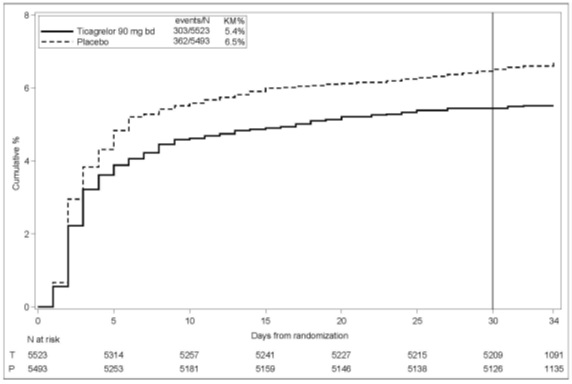
A cumulative percentage plot comparing event incidence over 34 days in patients randomized to Ticagrelor 90 mg twice daily versus placebo. The solid line represents Ticagrelor with a lower cumulative event percentage than the dashed line for placebo. The graph includes patient counts at risk over time below the x-axis.*
FDA Label Image

Ticagrelor-fig18.jpg (Ticagrelor Fig18)

Ticagrelor-fig18.jpg (Ticagrelor Fig18)
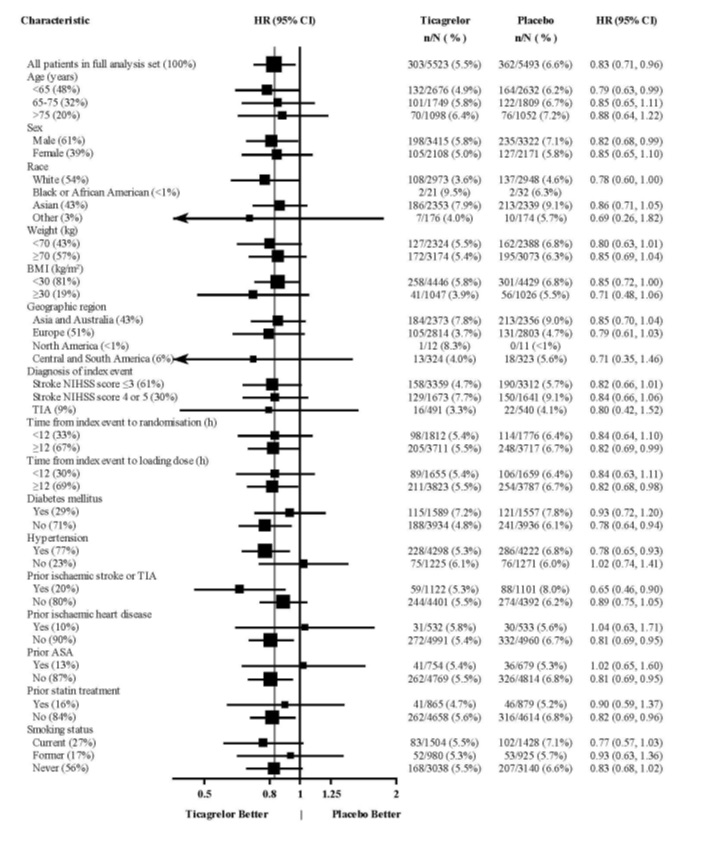
A forest plot chart comparing hazard ratios (HR) with 95% confidence intervals for various patient characteristics between Ticagrelor and placebo groups. The chart includes categories like age, sex, race, weight, BMI, geographic region, diagnosis, diabetes, hypertension, prior treatments, and smoking status, showing comparative effectiveness data for Ticagrelor tablets versus placebo.*
FDA Label Image

Ticagrelor-lbl60.jpg (Ticagrelor Lbl60)

Ticagrelor-lbl60.jpg (Ticagrelor Lbl60)
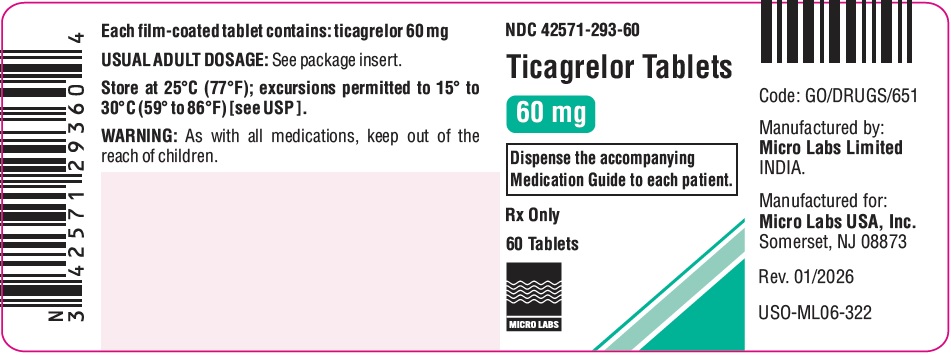
Label for Ticagrelor Tablets 60 mg film-coated tablets, containing 60 tablets per package. Manufactured by Micro Labs Limited, India, and labeled for Micro Labs USA, Inc. Instructions note usual adult dosage on package insert and storage between 15° to 30°C. The label includes a warning to keep out of reach of children and barcode information.*
FDA Label Image

Ticagrelor-lbl90.jpg (Ticagrelor Lbl90)

Ticagrelor-lbl90.jpg (Ticagrelor Lbl90)
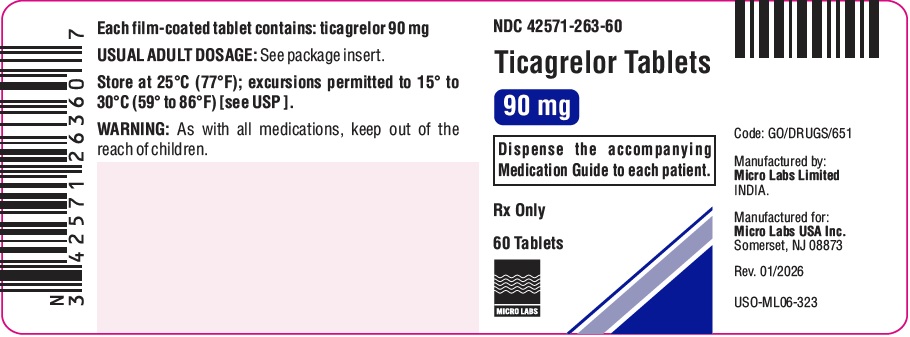
Ticagrelor 90 mg film-coated tablets packaging label showing the brand name, strength, dosage form, and quantity of 60 tablets. Manufactured by Micro Labs Limited, India, and labeled for Micro Labs USA Inc. The label includes storage instructions, a warning to keep out of reach of children, and a reminder to dispense the accompanying Medication Guide.*

* About these descriptions: Image descriptions on this page are generated by automated AI analysis of the product label images from the manufacturer's FDA label submission (SPL). They are provided for reference only and may contain errors or omissions. Always rely on the printed label itself and the official FDA labeling, and consult a pharmacist or healthcare professional with any questions about this product.