Dapagliflozin And Metformin Hydrochloride Tablet, Film Coated, Extended Release
Product Images NDC 42571-321

15 FDA label images from Micro Labs Limited · Packaging, Regulatory Labels, and Product Appearance

Product Visual Gallery

This gallery contains 15 technical images submitted to the FDA as part of the official labeling for Dapagliflozin And Metformin Hydrochloride (NDC 42571-321). Unlike standard consumer photos, these assets often include clinical data figures, molecular chemical structures, and official manufacturer packaging layouts.

As provided by Micro Labs Limited, these visuals offer a comprehensive scientific overview of the product's physical and chemical identity, aiding pharmacists and researchers in product verification and study.

FDA Label Image

Dapamet-10mg-1000mglbl (Dapamet 10mg 1000mglbl)
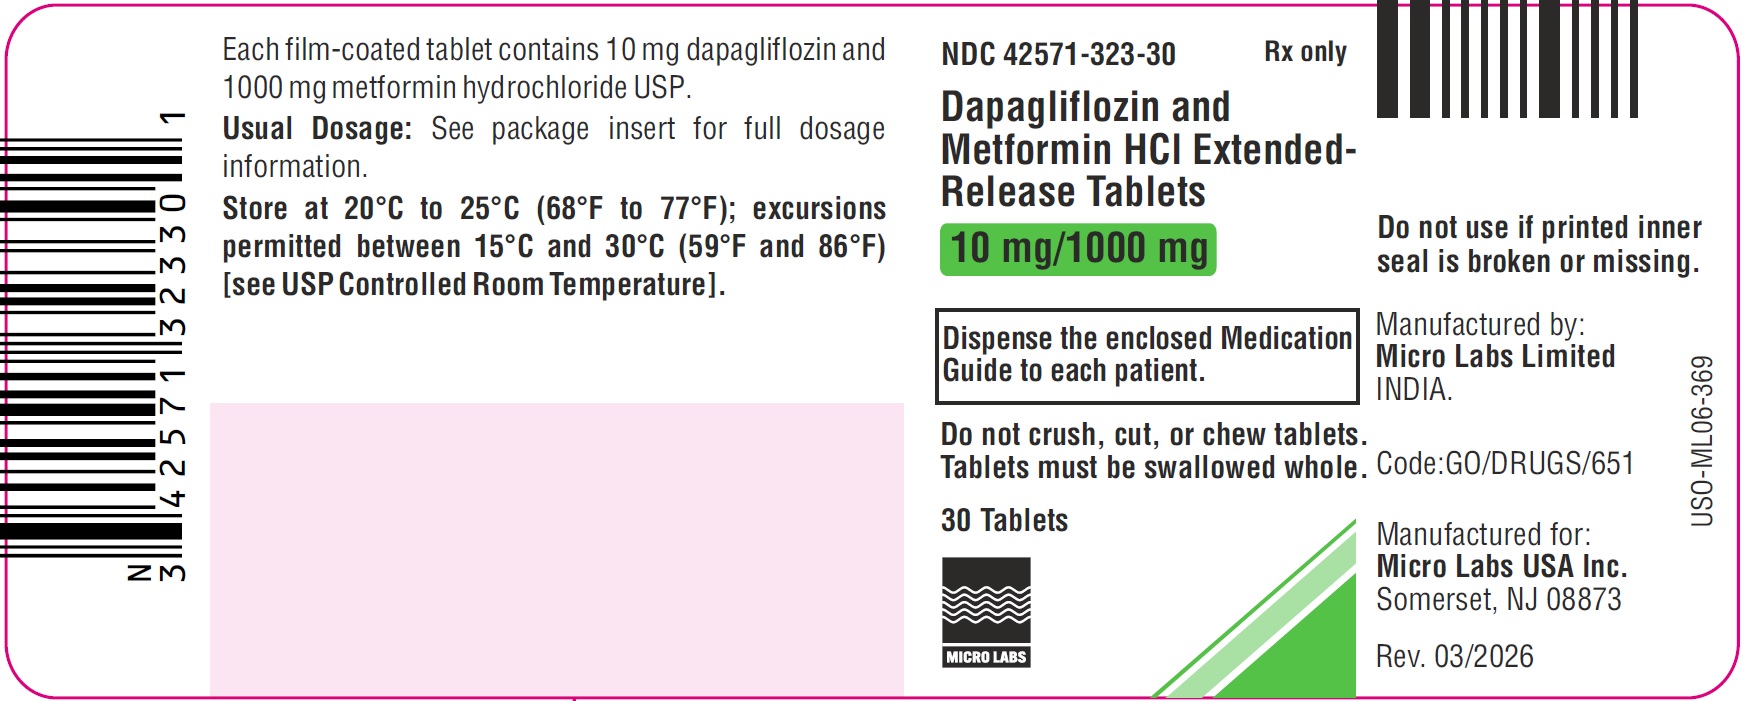
Dapamet-10mg-1000mglbl (Dapamet 10mg 1000mglbl)
Label for Dapagliflozin and Metformin Hydrochloride extended-release tablets, film coated, with a strength of 10 mg dapagliflozin and 1000 mg metformin hydrochloride. The label shows storage instructions (20°C to 25°C), a quantity of 30 tablets, and states "Rx only." Manufactured by Micro Labs Limited, India, and manufactured for Micro Labs USA Inc., Somerset, NJ. Includes barcode and directions not to crush, cut, or chew tablets.*
FDA Label Image

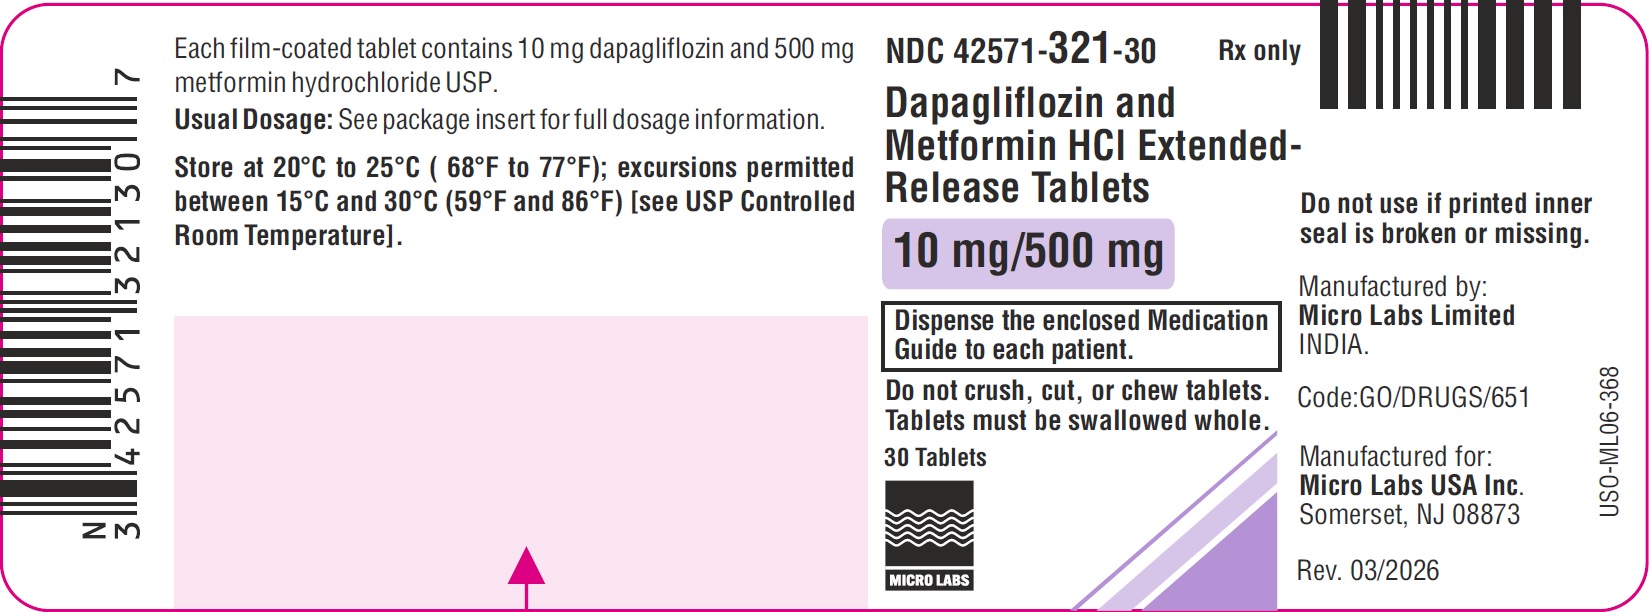
Dapamet-10mg-500mglbl (Dapamet 10mg 500mglbl)

Dapamet-10mg-500mglbl (Dapamet 10mg 500mglbl)
Packaging label for Dapagliflozin and Metformin HCl Extended-Release Tablets 10 mg/500 mg, film-coated tablets. The label states the product contains 10 mg dapagliflozin and 500 mg metformin hydrochloride per tablet, with a total of 30 tablets in the package. Manufactured by Micro Labs Limited, India, and labeled for Micro Labs USA Inc. The label includes NDC 42571-321-30, storage instructions, and a reminder not to crush, cut, or chew the tablets.*
FDA Label Image

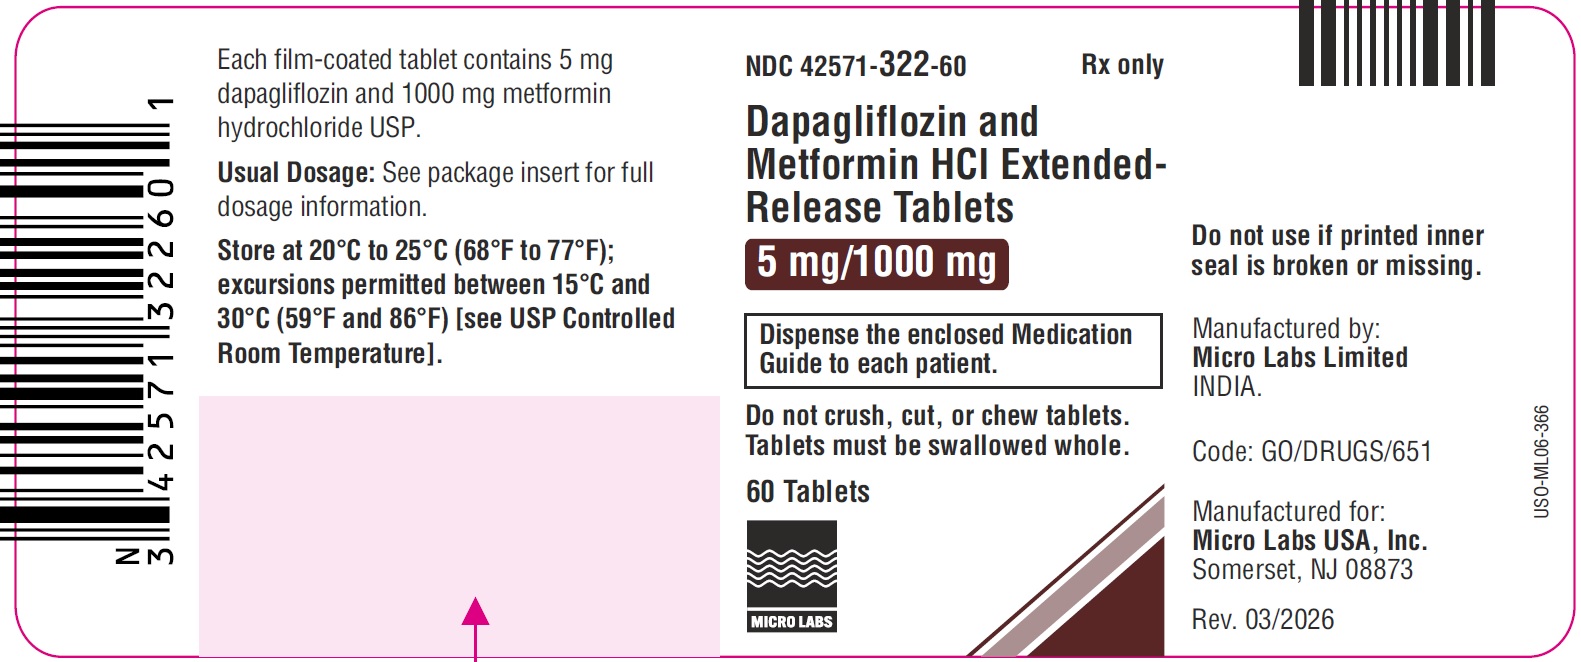
Dapamet-5mg-1000mglbl (Dapamet 5mg 1000mglbl)

Dapamet-5mg-1000mglbl (Dapamet 5mg 1000mglbl)
Label for Dapagliflozin and Metformin HCl Extended-Release Tablets 5 mg/1000 mg, film-coated tablets. The label includes storage instructions, dosage note, manufacturer information for Micro Labs Limited in India, and 60 tablets per container. It also advises not to crush or chew tablets and indicates the product is Rx Only.*
FDA Label Image

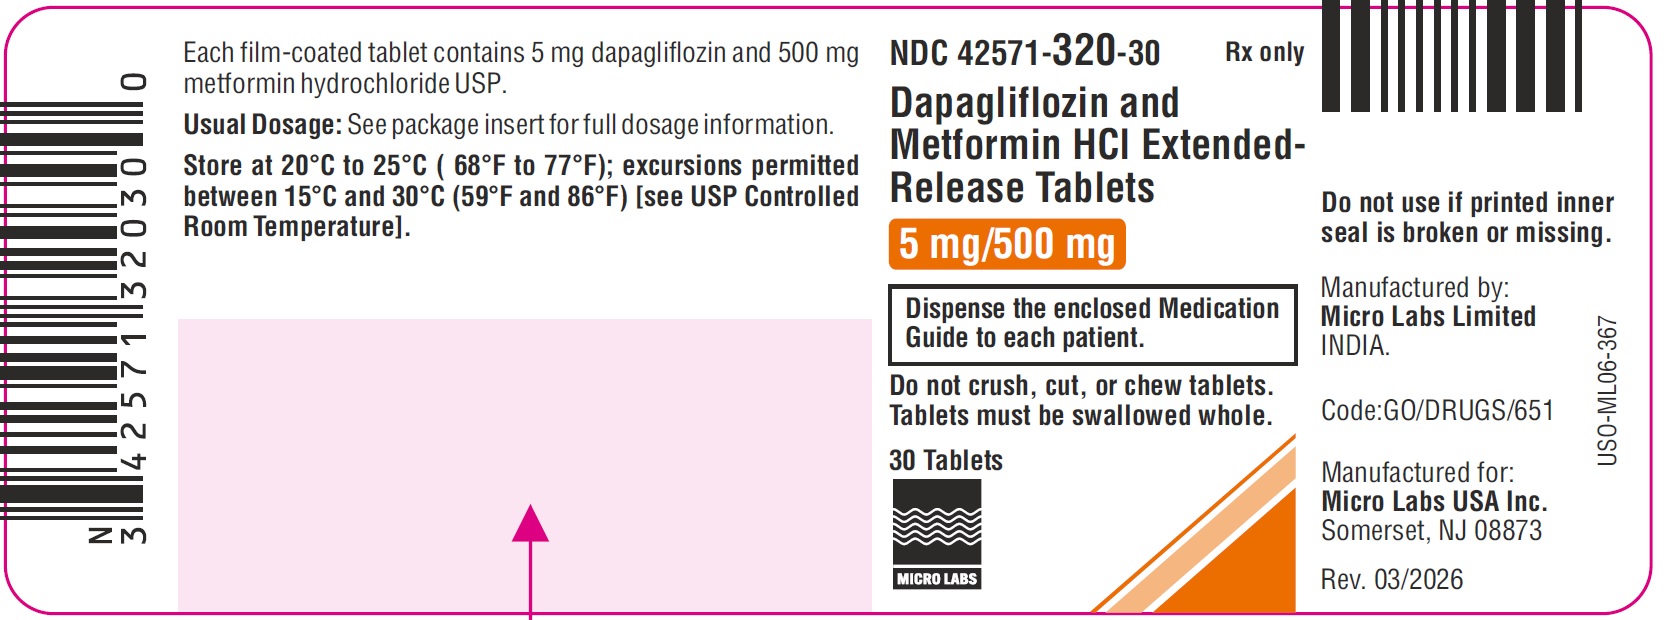
Dapamet-5mg-500mglbl (Dapamet 5mg 500mglbl)

Dapamet-5mg-500mglbl (Dapamet 5mg 500mglbl)
Label for Dapagliflozin and Metformin Hydrochloride Extended-Release Tablets, 5 mg/500 mg strength. The oral film-coated tablets come in a package of 30, manufactured by Micro Labs Limited and produced for Micro Labs USA Inc. Instructions include swallowing tablets whole and storing at 20°C to 25°C (68°F to 77°F). The label includes NDC 42571-320-30 and medication guide dispensing notice.*
FDA Label Image

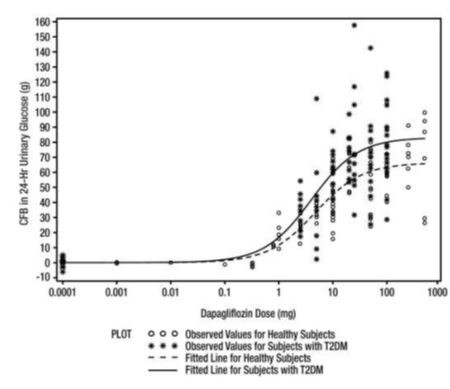
Dapamet-figu1 (Dapamet Figu1)

Dapamet-figu1 (Dapamet Figu1)
A dose-response plot showing change from baseline (CFB) in 24-hour urinary glucose (g) versus dapagliflozin dose (mg) on a logarithmic scale. The graph compares observed values and fitted lines for healthy subjects and subjects with type 2 diabetes mellitus (T2DM).*
FDA Label Image

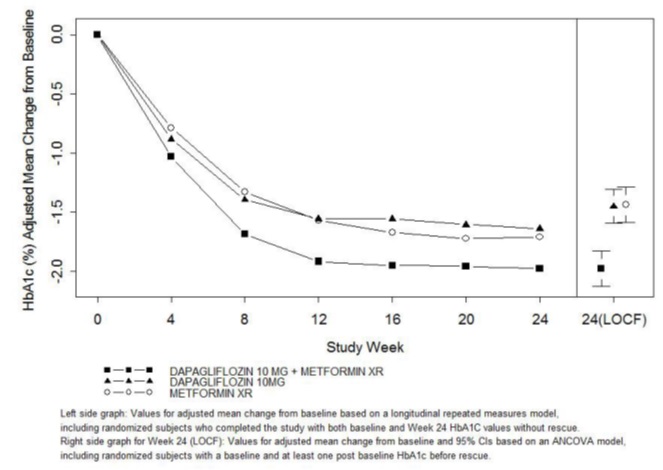
Dapamet-figu2 (Dapamet Figu2)

Dapamet-figu2 (Dapamet Figu2)
A line graph showing adjusted mean change from baseline in HbA1c (%) over 24 weeks of study for Dapagliflozin 10 mg, Metformin XR, and their combination. The x-axis represents study weeks, and the y-axis shows HbA1c change percentages. Different symbols denote the treatment groups, with a legend included. The right side includes mean change with 95% confidence intervals for Week 24 (LOCF).*
FDA Label Image

Dapamet-figu3 (Dapamet Figu3)

Dapamet-figu3 (Dapamet Figu3)
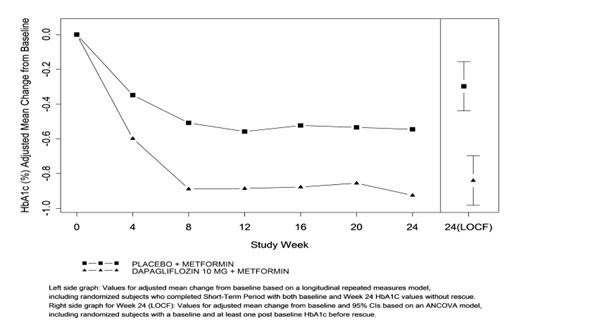
Line graph comparing HbA1c (%) adjusted mean change from baseline over 24 weeks in study participants receiving placebo plus metformin versus dapagliflozin 10 mg plus metformin. The x-axis shows study weeks; the y-axis shows HbA1c change. Dapagliflozin plus metformin shows greater reductions than placebo plus metformin over time, with 24-week least squares mean values indicated on the right.*
FDA Label Image

Dapamet-figu4 (Dapamet Figu4)

Dapamet-figu4 (Dapamet Figu4)
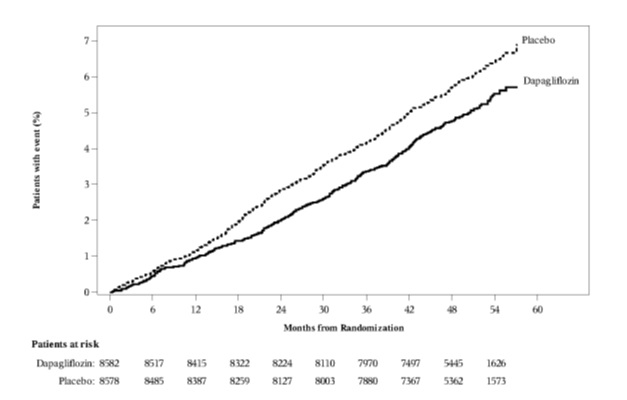
A line graph comparing the percentage of patients with an event over time (months from randomization) between Dapagliflozin and placebo groups. The graph shows patients at risk listed below the x-axis at multiple intervals up to 60 months. The placebo group has a higher event rate than the Dapagliflozin group throughout the period.*
FDA Label Image

Dapamet-figu5 (Dapamet Figu5)

Dapamet-figu5 (Dapamet Figu5)
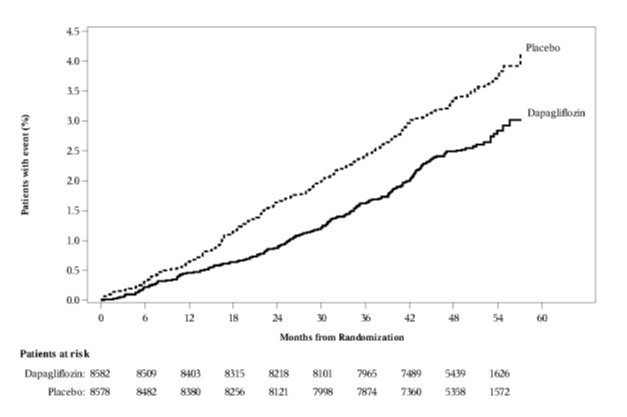
A line graph comparing the percentage of patients with events over 60 months between two groups: Dapagliflozin and Placebo. The x-axis shows months from randomization, and the y-axis shows the percentage of patients with events. The graph includes patient counts at risk for both groups over time, with the Placebo group showing a higher event rate than the Dapagliflozin group.*
FDA Label Image

Dapamet-figu6 (Dapamet Figu6)

Dapamet-figu6 (Dapamet Figu6)
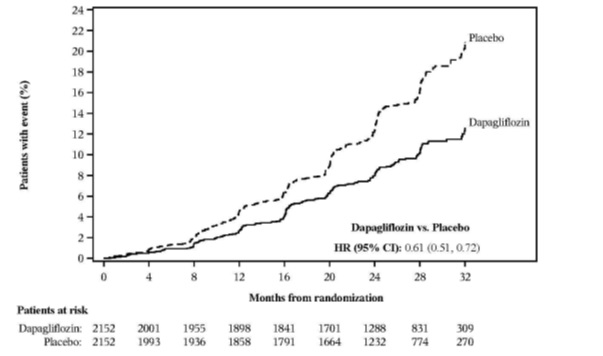
A Kaplan-Meier curve chart comparing the percentage of patients with an event over months from randomization between Dapagliflozin and Placebo groups. The chart shows two lines, with the Placebo group generally having a higher event percentage than the Dapagliflozin group. The graph includes hazard ratio data and counts of patients at risk over time for both groups.*
FDA Label Image

Dapamet-figu7 (Dapamet Figu7)

Dapamet-figu7 (Dapamet Figu7)
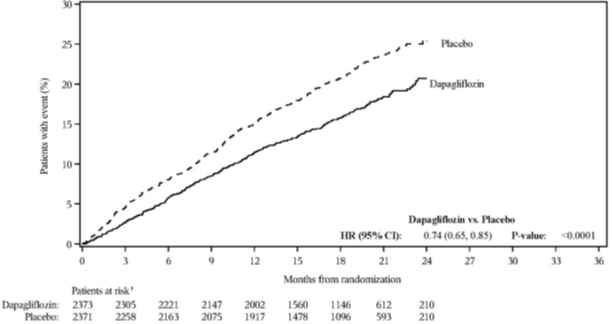
A Kaplan-Meier curve comparing the percentage of patients with an event over time between Dapagliflozin and Placebo groups. The x-axis shows months from randomization up to 36 months, and the y-axis shows percent of patients with an event up to 30%. The graph includes hazard ratio (HR 0.74, 95% CI 0.65-0.85) and a p-value <0.0001, indicating statistical comparison between Dapagliflozin and placebo. Patient risk numbers at various time points are listed below the graph.*
FDA Label Image

Dapamet-figu7b (Dapamet Figu7b)

Dapamet-figu7b (Dapamet Figu7b)
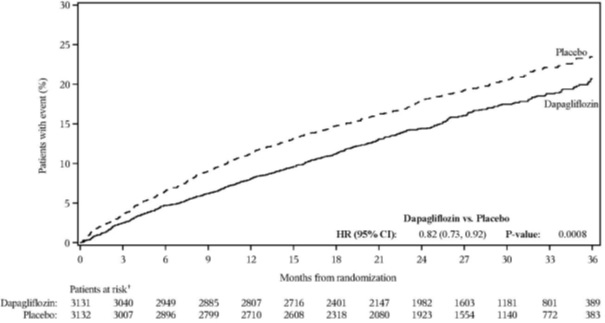
A line graph comparing the percentage of patients with events over 36 months from randomization between dapagliflozin and placebo groups. The x-axis shows time in months, and the y-axis shows percentage of patients with events. The graph includes a hazard ratio (HR) of 0.82 with a 95% confidence interval and a p-value of 0.0008, indicating statistical analysis of dapagliflozin versus placebo. Patient numbers at risk for each group are listed below the x-axis.*
FDA Label Image

Dapamet-figu8 (Dapamet Figu8)

Dapamet-figu8 (Dapamet Figu8)
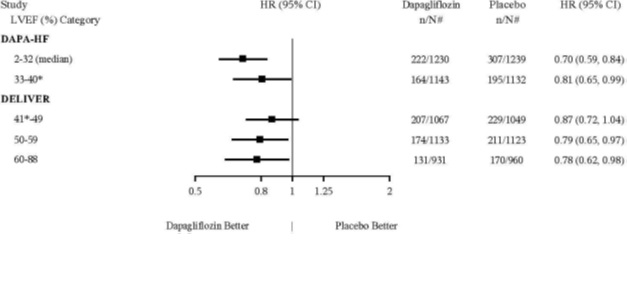
A forest plot chart comparing hazard ratios (HR) with 95% confidence intervals (CI) for different left ventricular ejection fraction (LVEF) percentage categories from studies labeled DAPA-HF and DELIVER. The chart displays data for dapagliflozin versus placebo, with numerical counts of events and total subjects for each group, illustrating treatment effects across multiple LVEF subgroups.*
FDA Label Image

Dapamet-metforminstruc.jpg (Dapamet Metforminstruc)

Dapamet-metforminstruc.jpg (Dapamet Metforminstruc)
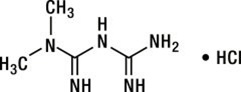
Chemical structure of Dapagliflozin and Metformin Hydrochloride, showing the molecular arrangement of its components including amine and methyl groups, connected to an HCl moiety.*
FDA Label Image

Dapamet-structure.jpg (Dapamet Structure)

Dapamet-structure.jpg (Dapamet Structure)
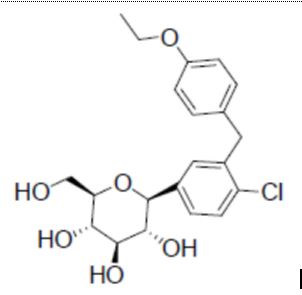
Chemical structure diagram of the active ingredient related to Dapagliflozin and Metformin Hydrochloride, showing a molecular structure with rings, hydroxyl groups, and chlorine substitution.*

* About these descriptions: Image descriptions on this page are generated by automated AI analysis of the product label images from the manufacturer's FDA label submission (SPL). They are provided for reference only and may contain errors or omissions. Always rely on the printed label itself and the official FDA labeling, and consult a pharmacist or healthcare professional with any questions about this product.