Tofacitinib Tablet, Film Coated
Product Images NDC 42571-377

View Photos of Packaging, Regulatory Labels, and Product Appearance

Product Visual Gallery

This gallery contains 10 technical images submitted to the FDA as part of the official labeling for Tofacitinib (NDC 42571-377). Unlike standard consumer photos, these assets often include clinical data figures, molecular chemical structures, and official manufacturer packaging layouts.

As provided by Micro Labs Limited, these visuals offer a comprehensive scientific overview of the product's physical and chemical identity, aiding pharmacists and researchers in product verification and study.

FDA Label Image

Tofacitinib-fig1 (Tofacitinib Fig1)
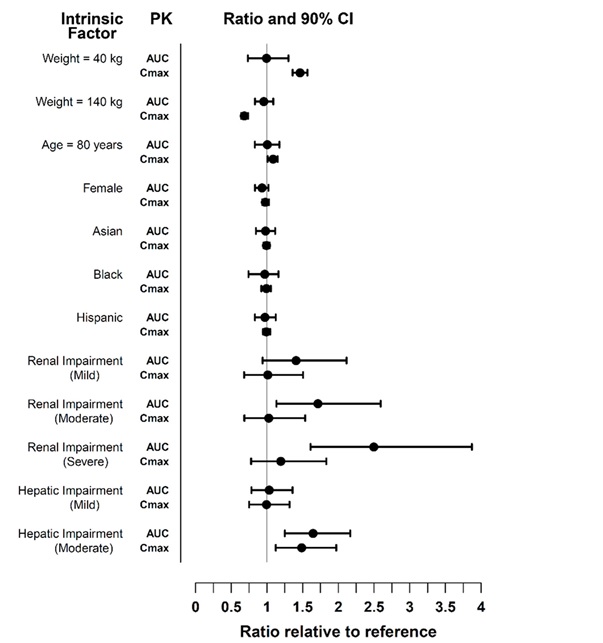
Tofacitinib-fig1 (Tofacitinib Fig1)
A pharmacokinetic (PK) chart showing the ratio and 90% confidence interval for AUC and Cmax values relative to reference across multiple intrinsic factors including weight (40 kg and 140 kg), age (80 years), sex (female), ethnicity (Asian, Black, Hispanic), and varying levels of renal and hepatic impairment (mild, moderate, severe). The chart illustrates variability in drug exposure metrics for tofacitinib among these groups.*
FDA Label Image

Tofacitinib-fig2.jpg (Tofacitinib Fig2)

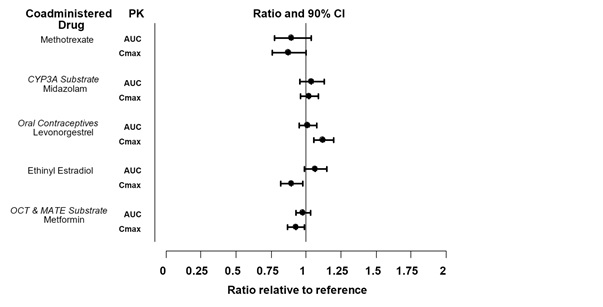
Tofacitinib-fig2.jpg (Tofacitinib Fig2)
A pharmacokinetic ratio chart comparing the area under the curve (AUC) and maximum concentration (Cmax) for various coadministered drugs with reference values. It includes methotrexate, CYP3A substrate midazolam, oral contraceptives levonorgestrel and ethinyl estradiol, and OCT & MATE substrate metformin, showing mean ratios and 90% confidence intervals relative to reference.*
FDA Label Image

Tofacitinib-fig3 (Tofacitinib Fig3)

Tofacitinib-fig3 (Tofacitinib Fig3)
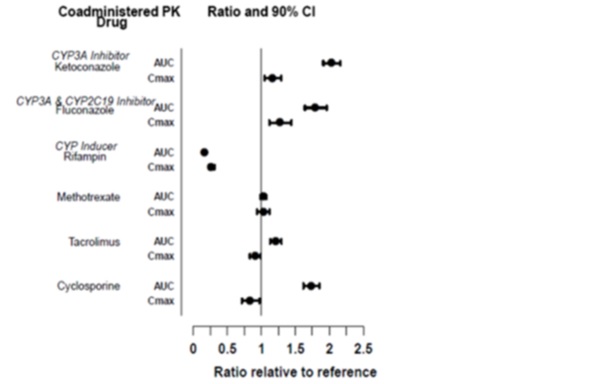
A scatter plot chart showing the pharmacokinetic (PK) impact of various coadministered drugs on the AUC and Cmax of a reference drug. The coadministered drugs include CYP3A Inhibitor Ketoconazole, CYP3A & CYP2C19 Inhibitor Fluconazole, CYP Inducer Rifampin, Methotrexate, Tacrolimus, and Cyclosporine. The x-axis represents the ratio relative to reference, ranging from 0 to 2.5, with corresponding 90% confidence intervals indicated for each data point.*
FDA Label Image

Tofacitinib-fig4.jpg (Tofacitinib Fig4)

Tofacitinib-fig4.jpg (Tofacitinib Fig4)
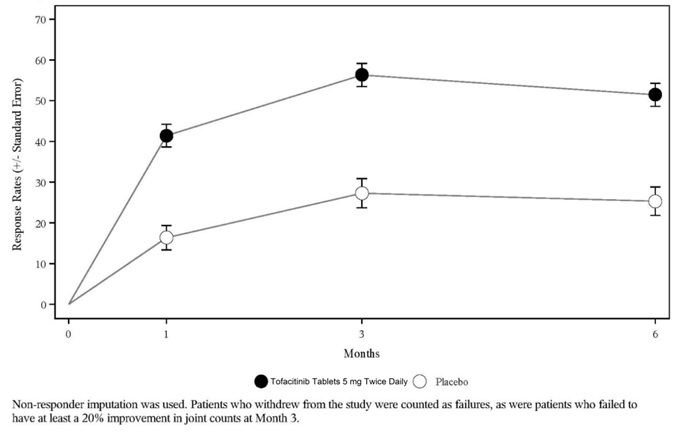
A line graph showing response rates with standard error over 6 months comparing Tofacitinib Tablets 5 mg twice daily and placebo. The graph plots response rates on the vertical axis and months on the horizontal axis, indicating higher response rates for Tofacitinib compared to placebo throughout the study period.*
FDA Label Image

Tofacitinib-fig5.jpg (Tofacitinib Fig5)

Tofacitinib-fig5.jpg (Tofacitinib Fig5)
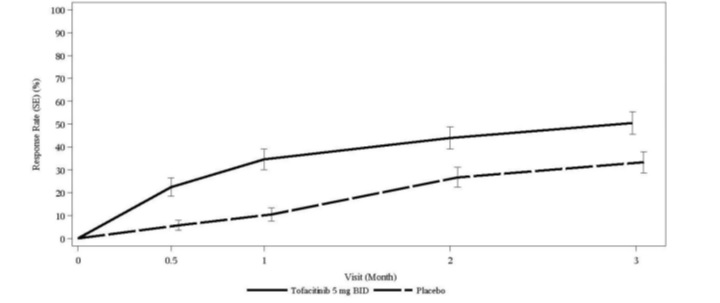
A line graph comparing response rates (%) over a 3-month period between Tofacitinib 5 mg twice daily (BID) and placebo. The x-axis represents visit month intervals (0, 0.5, 1, 2, 3), and the y-axis shows response rates from 0% to 100%. Tofacitinib shows higher response rates over time compared to placebo, with error bars indicating variability.*
FDA Label Image

Tofacitinib-fig6.jpg (Tofacitinib Fig6)

Tofacitinib-fig6.jpg (Tofacitinib Fig6)
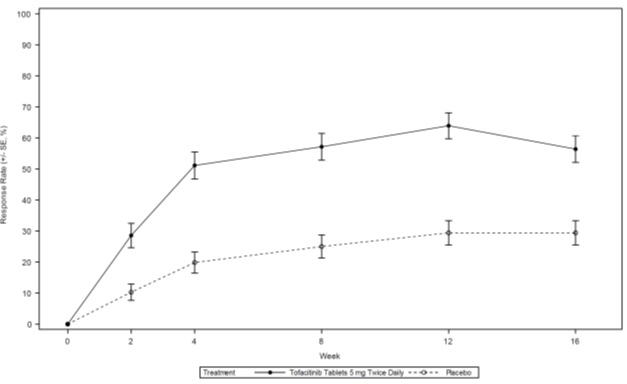
A line graph depicting response rates over a 16-week period comparing Tofacitinib Tablets 5 mg twice daily with placebo. The x-axis represents weeks, and the y-axis shows response rate percentages with error bars. Two lines indicate treatment effects, one solid for Tofacitinib and one dashed for placebo.*
FDA Label Image

Tofacitinib-fig7.jpg (Tofacitinib Fig7)

Tofacitinib-fig7.jpg (Tofacitinib Fig7)
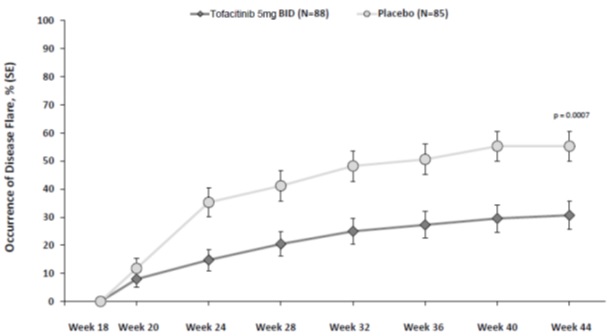
A line graph depicting the occurrence of disease flare (%) over time from Week 18 to Week 44, comparing two groups: Tofacitinib 5 mg BID (N=88) and Placebo (N=85). The y-axis shows the percentage of disease flare with standard error bars, while the x-axis shows the weeks. The graph illustrates a lower occurrence of disease flare in the Tofacitinib group compared to Placebo, with a statistical significance noted at p = 0.0007 near Week 44.*
FDA Label Image

Tofacitinib-lbl10mg.jpg (Tofacitinib Lbl10mg)

Tofacitinib-lbl10mg.jpg (Tofacitinib Lbl10mg)
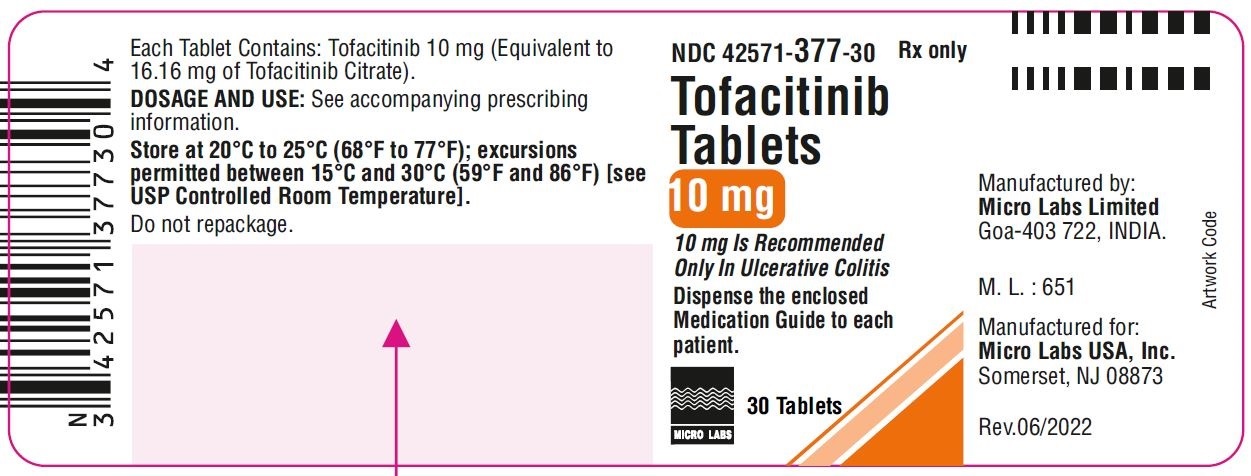
Label for Tofacitinib Tablets 10 mg, film-coated oral tablets. The label states 30 tablets per container and highlights the strength as 10 mg. Manufactured by Micro Labs Limited in Goa, India, and for Micro Labs USA, Inc. It includes temperature storage instructions and a barcode. The label notes dispensing an enclosed medication guide.*
FDA Label Image

Tofacitinib-lbl5mg.jpg (Tofacitinib Lbl5mg)

Tofacitinib-lbl5mg.jpg (Tofacitinib Lbl5mg)
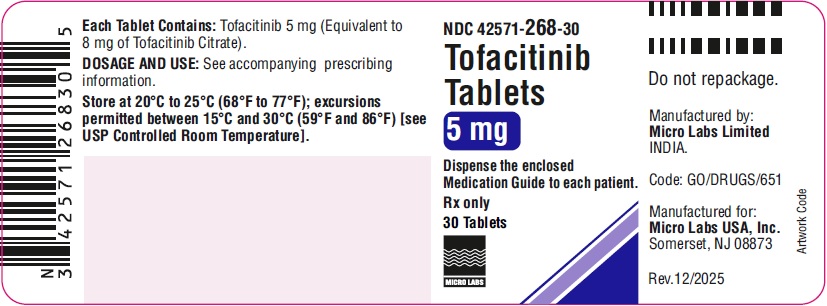
Label for Tofacitinib 5 mg tablets, oral film-coated tablets supplied in a package of 30 tablets. The label includes storage instructions, dispensing guidance, manufacturer Micro Labs Limited, and distributor Micro Labs USA, Inc., with regulatory and barcode information.*
FDA Label Image

Tofacitinib-str.jpg (Tofacitinib Str)

Tofacitinib-str.jpg (Tofacitinib Str)
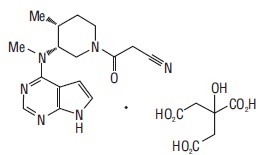
Chemical structure of tofacitinib, showing the molecular arrangement including a six-membered ring with nitrogen atoms and various functional groups, paired with a separate structure of a tetracarboxylic acid compound likely representing an associated molecule or salt form.*

* About these descriptions: Image descriptions on this page are generated by automated AI analysis of the product label images from the manufacturer's FDA label submission (SPL). They are provided for reference only and may contain errors or omissions. Always rely on the printed label itself and the official FDA labeling, and consult a pharmacist or healthcare professional with any questions about this product.