Product Images Donepezil Hyrochloride 5mg

View Photos of Packaging, Labels & Appearance

Product Label Images

The following 20 images provide visual information about the product associated with Donepezil Hyrochloride 5mg NDC 42582-311 by Bi-coastal Pharma International Llc, such as packaging, labeling, and the appearance of the drug itself. This resource could be helpful for medical professionals, pharmacists, and patients seeking to verify medication information and ensure they have the correct product.

image11 - container label 10mg

image11 - container label 10mg

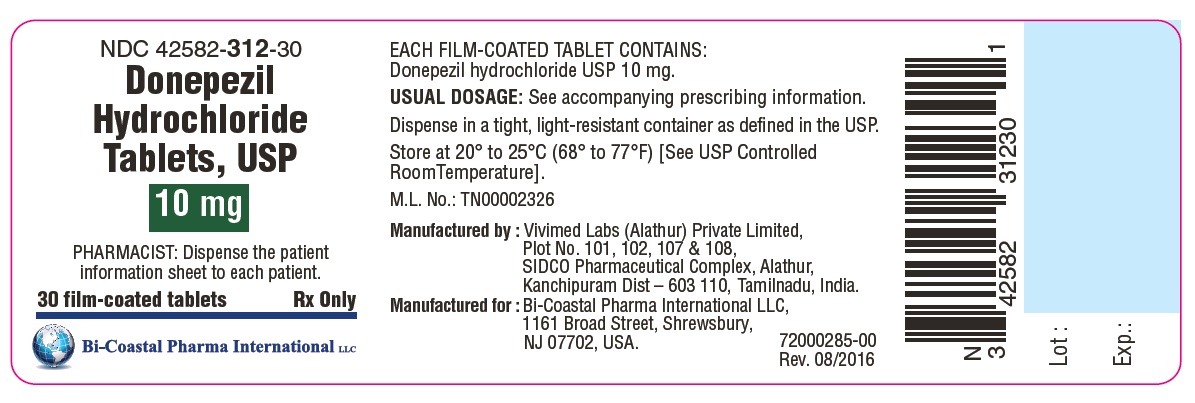
This is a medication called Donepezil Hydrochloride in the form of tablets. Each film-coated tablet contains 10 mg of Donepezil Hydrochloride. The usual recommended dosage is not provided and the pharmacist is instructed to dispense a patient information sheet to each patient. The medication should be stored in a tightly sealed, light-resistant container at a temperature between 20° to 25°C (68° to 77°F). The manufacturer is Vivimed Labs (Alathur) Private Limited located in Tamilnadu, India and it is manufactured for Bi-Coastal Pharma International LLC, located in Shrewsbury, NJ, USA.*

image10 - container label 5mg

image10 - container label 5mg

This is a description of Donepezil Hydrochloride tablets, USP with NDC code 42582-311-30. Each film-coated tablet contains 5mg of Donepezil hydrochloride as the active ingredient. This medication is dispensed in a container that is light-resistant as defined in the USP, and should be stored in a cool place at a temperature ranging between 20-25°C. The usual dosage information is contained in the accompanying prescribing information, and each patient should receive the patient information sheet. The tablets are produced by Vivimed Labs (Alathur) Private Limited, and distributed by Bi-Coastal Pharma International LLC. The Lot and Exp. number are not provided.*

donepezil 1

donepezil 1

donepezil 2

donepezil 2

donepezil 3

donepezil 3

donepezil 4

donepezil 4

figure 10

figure 10

The text describes a graph with the Cumulative Percentage of Patients on the vertical axis and the ADCS-ADL Change from Baseline on the horizontal axis. The graph compares the effects of Donepezil Hydrochloride 10 mg/day versus a placebo on patients. The lines on the graph represent the cumulative percentage of patients for each treatment.*

figure 11

figure 11

figure 12

figure 12

The text contains a graph displaying the Cumulative Percentage of Patients with Donepezil hydrochloride 23 mg/day and 10 mg/day, and a data table showing the SIB Change from Baseline. Not available for further description due to lack of context and clarity.*

figure 13

figure 13

This appears to be a table related to patient ratings of improvement while taking either 23mg/day or 10mg/day of Donepezil hydrochloride, which is used to treat dementia. However, due to the incomplete and fragmented nature of the text with some characters missing or unreadable, it may not be possible to derive any further accurate or useful information from it.*

figure 01

figure 01

This text appears to be presenting data from a clinical trial evaluating the effectiveness of different doses of Donepezil hydrochloride for improvement in cognitive function over time. The doses tested were 5 mg/day and 10 mg/day, and a placebo was also used as a control. The data is shown graphically with the weeks of drug treatment on the x-axis and the degree of clinical improvement or decline on the y-axis. The text appears to be missing some information or context that would provide more detail about the trial or the condition being studied.*

figure 02

figure 02

This is a graph showing the cumulative percentage of patients who experienced a no-change or improvement in ADAS-cog scores after being treated with Donepezil hydrochloride 5 mg/day, Donepezil hydrochloride 10 mg/day, or placebo. The X-axis represents a change in ADAS-cog score from baseline, while the Y-axis represents the percentage of patients who experienced a change or no change. The data in the graph suggests that patients treated with Donepezil hydrochloride 10 mg/day experienced the highest percentage of improvement, followed by Donepezil hydrochloride 5 mg/day and then placebo.*

figure 03

figure 03

This appears to be a table with medication dosages and their effectiveness on patients' CIBIC-plus ratings. The percentages of patients who had marked, moderate, minimal, or no improvement, as well as those who had worsened, are provided for Donepezil hydrochloride in 5mg and 10mg doses, as well as for a placebo.*

figure 04

figure 04

This is a graph showing the change from baseline in ADAS-cog (a cognitive assessment tool) score over 12 weeks of drug treatment for two doses of Donepezil hydrochloride (5mg/day and 10mg/day) and placebo. The lines representing the change from baseline scores for each drug treatment group intersect at week 6, indicating that at this time point there was no significant difference in cognitive improvement between the three groups. However, by week 12, both doses of Donepezil were associated with significantly greater improvement than placebo. The graph also shows a clinical improvement for both doses of Donepezil and a clinical decline for placebo.*

figure 05

figure 05

The text appears to be a chart or table showing the cumulative percentage of patients in different treatment groups and their change in ADAS-cog score from baseline. The treatment groups include a placebo group, a group receiving 5mg/day of Donepezil hydrochloride, and a group receiving 10mg/day of the same drug. The chart also shows the percentage of patients in each group who experienced a particular level of improvement in ADAS-cog score. As the text is not very clear, it may not be possible to extract more insights from it.*

figure 06

figure 06

This appears to be a portion of a table or graph displaying patient percentages in relation to Donepezil hydrochloride and placebo treatments. It includes a rating system from "Markedly Improved" to "Markedly Worse." A proper description of this dataset would require additional context.*

figure 07

figure 07

This is a table that presents the mean change from baseline on SIB (Severe Impairment Battery) and Clinical Decline after 3 months of drug treatment. There are two columns in the table indicating the mean change for Donepezil hydrochloride 10 mg/day and Placebo, respectively.*

figure 08

figure 08

The text describes a chart showing the cumulative percentage of patients who experienced a change from baseline in SIB (Severe Impairment Battery) scores while taking either donepezil hydrochloride or placebo. The chart displays two lines, one for each treatment option, with the x-axis representing time in weeks and the y-axis representing the percentage of patients. The chart shows that donepezil hydrochloride resulted in a greater percentage of patients with a positive change in SIB scores compared to placebo.*

figure 09

figure 09

This appears to be a graph or chart with headings "Clinical Improvement", "Baseline", "Donepezil hydrochloride 10 mg/day", "Placebo", "Clinical Decline", and "Months of Drug Treatment". It may be showing the effects of drug treatment on clinical improvement or decline over a period of three months. Without further context or details, it is difficult to provide a more specific description.*

structure 1

structure 1

* The product label images have been analyzed using a combination of traditional computing and machine learning techniques. It should be noted that the descriptions provided may not be entirely accurate as they are experimental in nature. Use the information in this page at your own discretion and risk.