Product Images Atorvastatin Calcium

View Photos of Packaging, Labels & Appearance

Product Label Images

The following 7 images provide visual information about the product associated with Atorvastatin Calcium NDC 42708-003 by Qpharma Inc, such as packaging, labeling, and the appearance of the drug itself. This resource could be helpful for medical professionals, pharmacists, and patients seeking to verify medication information and ensure they have the correct product.

Label - 42708 003 30

Label - 42708 003 30

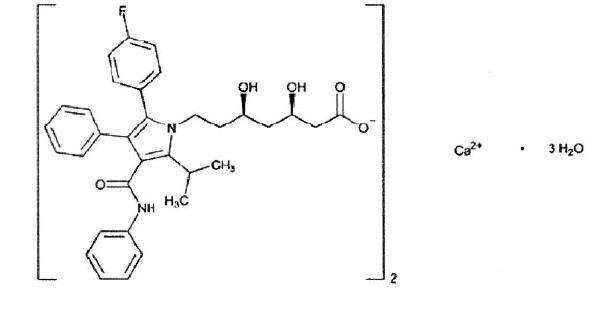
This is a medication label for Atorvastatin Calcium, a drug used to lower cholesterol levels in the blood. The label provides instructions on how to take the medication, including dosage and frequency. It also includes important information such as the lot number, expiration date, and distributor name. Users should keep the container tightly closed and out of reach of children. This medication should only be taken with a prescription from a healthcare provider.*

Label - 42708 004 30

Label - 42708 004 30

useful description cannot be generated as there is missing information in the text. The dosage frequency and the number of tablets to be taken are left blank.*

Label - 42708 005 30

Label - 42708 005 30

This is a medication label for Atorvastatin Calcium. The dosage instructions are partially filled and it indicates that the tablets are to be stored at room temperature. It also provides the NDC, lot number, and expiration date of the medication. The medication is distributed by QPharma, Inc. and it is only available through prescription.*

Chemical Structure - image 1

Chemical Structure - image 1

figure 1 - image 2

figure 1 - image 2

This text appears to be a statistical analysis report comparing the effect of Atorvastatin (a drug used to lower cholesterol levels) versus a placebo. The report presents the cumulative incidence in percentage for different age brackets (40+) and shows that Atorvastatin has a lower incidence rate compared to the placebo. The study was conducted for 3.5 years and the statistical significance of the results is indicated by the p-value (p=0.0005).*

Figure 2 - image 3

Figure 2 - image 3

The text represents a graph or chart showing the Cumulative Hazard (%) and Time to First Primary Endpoint Through Four (4) Years of Follow-up (Years). The hazard percentage increases with time, and the graph shows that after four years, the hazard will be significantly higher. The HR is 0.63, and the p-value is 0.001. This information appears to be from a medical study or clinical trial.*

figure 3 - image 4

figure 3 - image 4

This is a statistical report on the effectiveness of two different doses of Atorvastatin medication on major cardiovascular events. The table shows the percentage of subjects who experienced the event, and the HR (Hazard Ratio) and p-value for each dose. The higher dose (80mg) had a lower percentage of subjects experiencing the event, with a statistically significant HR of 0.78 (meaning a lower risk) compared to the lower dose (10mg). The graph shows the time to the first major cardiovascular endpoint over four years.*

* The product label images have been analyzed using a combination of traditional computing and machine learning techniques. It should be noted that the descriptions provided may not be entirely accurate as they are experimental in nature. Use the information in this page at your own discretion and risk.