Carvedilol Tablet, Film Coated
Product Images NDC 42708-072

View Photos of Packaging, Regulatory Labels, and Product Appearance

Product Visual Gallery

This gallery contains 6 technical images submitted to the FDA as part of the official labeling for Carvedilol (NDC 42708-072). Unlike standard consumer photos, these assets often include clinical data figures, molecular chemical structures, and official manufacturer packaging layouts.

As provided by Qpharma, Inc., these visuals offer a comprehensive scientific overview of the product's physical and chemical identity, aiding pharmacists and researchers in product verification and study.

FDA Label Image

Structural Formula For Carvedilol (Image 01)

Structural Formula For Carvedilol (Image 01)
Chemical structure of Carvedilol showing its molecular framework including aromatic rings, ether linkages, hydroxyl, and amine functional groups.*
FDA Label Image

Figure 1 (Image 02)

Figure 1 (Image 02)
A line chart comparing mortality percentage over a 21-month period between two groups labeled "Placebo" and "Carvedilol." The chart shows mortality increasing over time for both groups, with the placebo group having a consistently higher mortality percentage. A p-value of 0.0014 is noted on the chart, indicating statistical analysis.*
FDA Label Image

Figure 2 (Image 03)

Figure 2 (Image 03)
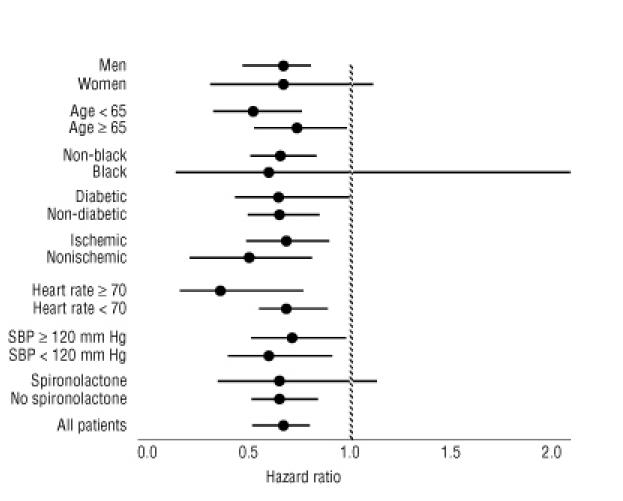
A horizontal forest plot illustrating hazard ratios for different patient subgroups including men, women, age groups, race, diabetic status, ischemic status, heart rate categories, systolic blood pressure groups, and use of spironolactone. Each subgroup is represented by a dot with confidence intervals, plotted along a horizontal axis labeled 'Hazard ratio' from 0.0 to 2.0, with a vertical dashed line at 1.0 indicating no effect.*
FDA Label Image

Figure 3 (Image 04)

Figure 3 (Image 04)
A line graph comparing percent mortality over 24 months between placebo and carvedilol treatment groups. The x-axis represents time in months from 0 to 24; the y-axis shows percent mortality from 0% to 30%. Curves indicate lower mortality for carvedilol versus placebo, with a p-value of 0.03.*
FDA Label Image

Figure 4 (Image 05)

Figure 4 (Image 05)
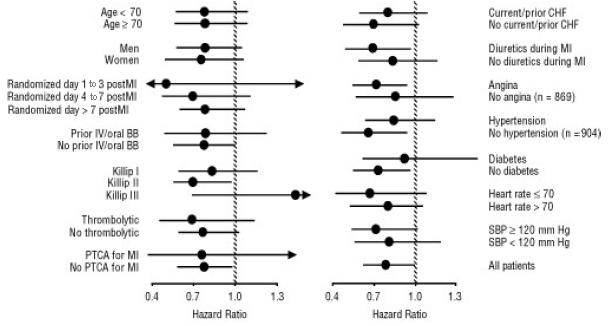
A forest plot chart depicting hazard ratios for various patient subgroups related to cardiovascular conditions and treatments. Subgroups include age, gender, timing post-myocardial infarction, beta-blocker use, Killip class, thrombolytic status, PTCA, history of congestive heart failure, diuretic use, angina, hypertension, diabetes, heart rate, and systolic blood pressure. Each subgroup features points and confidence intervals along a hazard ratio scale from 0.4 to 1.3.*
FDA Label Image

42708-072-60 Carvedilol Tablets Usp 3.125mg X 60 (Image 06)

42708-072-60 Carvedilol Tablets Usp 3.125mg X 60 (Image 06)
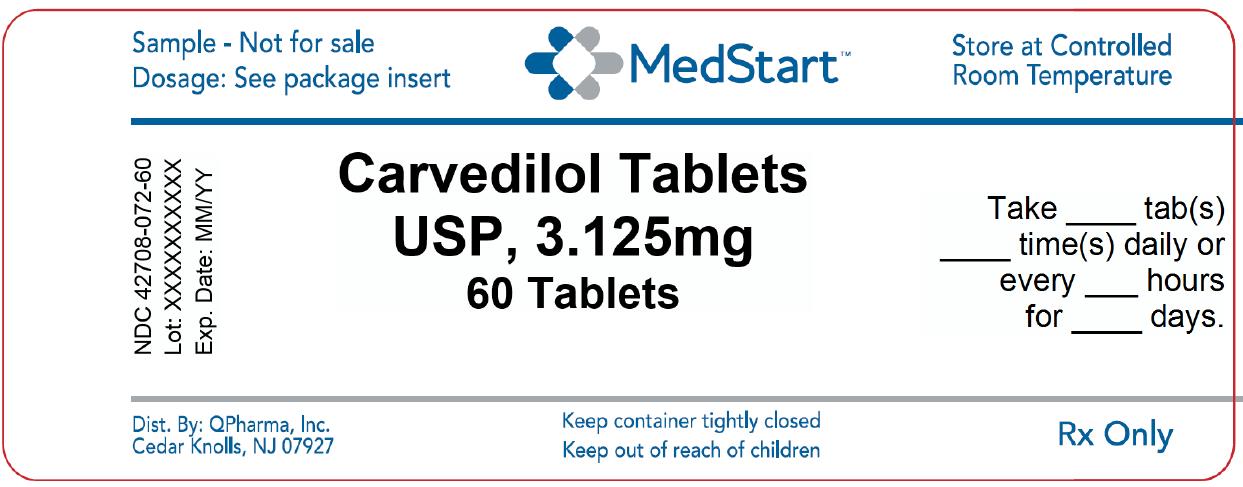
Label for Carvedilol Tablets USP, 3.125 mg oral film-coated tablets in a 60-tablet package. The label includes storage instructions at controlled room temperature, and notes that it is a sample not for sale. It is distributed by QPharma, Inc., Cedar Knolls, NJ. The label has dosage instructions placeholder fields and safety warnings to keep the container tightly closed and out of reach of children. Marked Rx Only.*

* About these descriptions: Image descriptions on this page are generated by automated AI analysis of the product label images from the manufacturer's FDA label submission (SPL). They are provided for reference only and may contain errors or omissions. Always rely on the printed label itself and the official FDA labeling, and consult a pharmacist or healthcare professional with any questions about this product.