Nintedanib Capsule
Product Images NDC 42799-972

View Photos of Packaging, Regulatory Labels, and Product Appearance

Product Visual Gallery

This gallery contains 12 technical images submitted to the FDA as part of the official labeling for Nintedanib (NDC 42799-972). Unlike standard consumer photos, these assets often include clinical data figures, molecular chemical structures, and official manufacturer packaging layouts.

As provided by Edenbridge Pharmaceuticals Llc., these visuals offer a comprehensive scientific overview of the product's physical and chemical identity, aiding pharmacists and researchers in product verification and study.

FDA Label Image

1 (100mg Bottle Label)

1 (100mg Bottle Label)
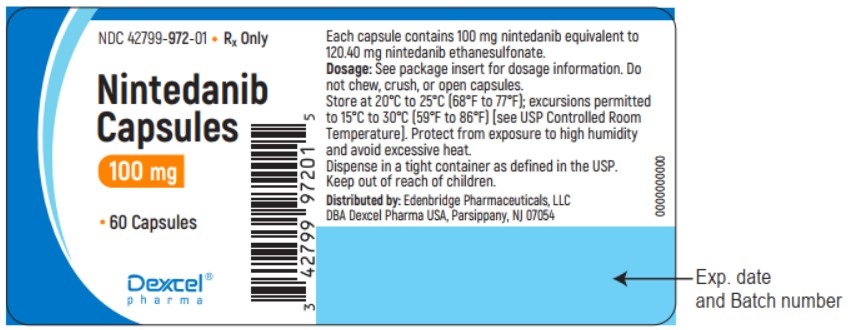
This is a description of Nintedanib capsules with a dosage of 100 mg. The capsules are to be stored between 20°C to 25°C, with excursions permitted between 15°C to 30°C. It is advised not to chew, crush, or open the capsules. The medication is distributed by Edenbridge Pharmaceuticals, LLC under DBA Dexcel Pharma USA. The expiration date and batch number are provided for reference.*
FDA Label Image

1 (150mg Bottle Label)

1 (150mg Bottle Label)
This is information regarding nintedanib capsules, each containing 150 mg of nintedanib equivalent to 180.60 mg of nintedanib ethanesulfonate. The recommended storage temperature is between 20°C to 25°C (68°F to 77°F) with excursions permitted with guidelines for storage temperature range from 15°C to 30°C (59°F to 86°F). It highlights the need to protect the capsules from exposure to high humidity and excessive heat and to keep them out of reach of children. The product is distributed by Edenbridge Pharmaceuticals, LLC and dispensed in a tight container as defined in the USP. The package contains 60 capsules from Dexcel Pharma USA, with Batch number and an expiration date provided. For specific dosage instructions, refer to the package insert.*
FDA Label Image

1 (Figure 1)

1 (Figure 1)
This description includes information about the mean forced vital capacity (FVC) change from baseline over time in Study 2. The figure shows the observed FVC changes for the placebo and nintedanib (150 mg twice daily) groups. The graph displays a decline in FVC over time for both groups with the most noticeable changes observed around the 35th and 70th time points. The number of patients in each group is also provided, with 202 patients in the placebo group and 303 patients in the nintedanib group.*
FDA Label Image

1 (Figure 2)

1 (Figure 2)
This description presents a figure illustrating the distribution of patients based on the change in percent predicted Forced Vital Capacity (FVC) from baseline to Week 52 in Study 2. The figure includes vertical lines indicating >0% decline or >10% decline in FVC. The data compares the placebo group (204 patients) with the group treated with Nintedanib 150 mg bid (309 patients). Missing data was imputed using the worst decline from baseline at Week 52 observed among all patients with available data, regardless of treatment. The term "bid" stands for twice daily dosing.*
FDA Label Image

1 (Figure 3)

1 (Figure 3)
The -generated text describes Figure 3 showing Kaplan-Meier Estimates of All-Cause Mortality at Vital Status for Study 2 and Study 3. The graph displays the Hazard ratio as 0.70 with a 95% Confidence Level (CI) between 0.43 and 1.12. It also indicates that the study involves a comparison between Placebo and Nintedanib 150mg twice daily over 52 weeks. The data range includes a period from 0 to 373 days, with the number at risk indicated for each time point.*
FDA Label Image

1 (Figure 4)

1 (Figure 4)
This text provides information on the annual rate of decline in Forced Vital Capacity (FVC) over 52 weeks based on underlying Interstitial Lung Disease (ILD) diagnosis in Study 5. It includes data for different ILD diagnoses such as autoimmune ILDs, hypersensitivity pneumonitis, idiopathic nonspecific interstitial pneumonia, and other ILDs. The numbers represent the estimate and 95% confidence interval for the decline in FVC for the placebo and Nintedanib groups. Additionally, it explains the ILD categories and specifies that the results are from a post-hoc exploratory analysis for descriptive purposes.*
FDA Label Image

1 (Figure 5)

1 (Figure 5)
The text provides information regarding the mean observed forced vital capacity (FVC) change from baseline over 52 weeks in Study 5. It includes data on the number of patients in the placebo and Nintedanib groups, as well as the FVC changes in mL for both treatment groups. The study evaluated the efficacy of Nintedanib administered twice daily.*
FDA Label Image

1 (Figure 6)

1 (Figure 6)
The text provides a histogram showing the Percent Change in Forced Vital Capacity (FVC) from the baseline to Week 52 based on different treatments and percentage increments or decrements of 5. The figure illustrates the distribution of patients who saw improvement, worsening, or had missing data. Additionally, it mentions details about patients classified as having missing FVC data at Week 52 and the frequency of assessments. The study involved Placebo and Nintedanib treatments.*
FDA Label Image

1 (Nintedanib Esylate)

FDA Label Image

1 (Table 1)

1 (Table 1)
This text presents adverse reactions occurring in more than 5% of Nintedanib Capsules-treated patients with Idiopathic Pulmonary Fibrosis. The most common adverse reactions compared to placebo include diarrhea, nausea, abdominal pain, liver enzyme elevation, decreased appetite, headache, weight decreased, and hypertension. It also explains the different categories of adverse reactions such as gastrointestinal disorders, metabolism and nutrition disorders, nervous system disorders, investigations, and vascular disorders. It provides detailed percentages for each adverse reaction reported in the studies.*
FDA Label Image

1 (Table 3)

1 (Table 3)
This table shows the annual rate of decline in Forced Vital Capacity (FVC) in three different studies. The studies compare the effects of Nintedanib capsules versus Placebo capsules on FVC decline over 52 weeks. Study 1, with 84 analyzed patients, showed a FVC decline of -60 ml for Nintedanib and -191 ml for Placebo. Study 2, with 309 patients, had decline rates of -115 ml for Nintedanib and -240 ml for Placebo. Study 3, with 329 patients, showed -114 ml decline for Nintedanib and -207 ml for Placebo. The comparison against Placebo resulted in differences of 131 ml, 125 ml, and 94 ml, respectively, for the three studies with corresponding confidence intervals provided.*
FDA Label Image

1 (Table 4)

1 (Table 4)
This text provides information on the annual rate of decline in Forced Vital Capacity (FVC) in Study 5 for different subpopulations and treatment groups. The data includes the number of analyzed patients, adjusted annual rate of decline over 52 weeks, and the comparison against placebo. The comparison is based on a random coefficient regression model with various fixed effects. The results suggest a significant difference in the decline in FVC between Nintedanib and Placebo, particularly in the UIP-like subpopulation. The information is crucial for understanding the efficacy of Nintedanib treatment in managing FVC decline in specific subpopulations.*

* These product label images have been analyzed using experimental machine learning. Please verify findings with the primary label text.