Nintedanib Capsule
Product Images NDC 42806-569

View Photos of Packaging, Regulatory Labels, and Product Appearance

Product Visual Gallery

This gallery contains 9 technical images submitted to the FDA as part of the official labeling for Nintedanib (NDC 42806-569). Unlike standard consumer photos, these assets often include clinical data figures, molecular chemical structures, and official manufacturer packaging layouts.

As provided by Epic Pharma Llc, these visuals offer a comprehensive scientific overview of the product's physical and chemical identity, aiding pharmacists and researchers in product verification and study.

FDA Label Image

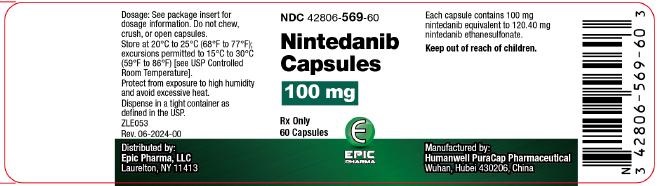
Container-label-100mg-60ct-jpg (100mg 60ct Container)
Container-label-100mg-60ct-jpg (100mg 60ct Container)
Nintedanib Capsules 100 mg oral capsules packaging label from Epic Pharma LLC. The label indicates a quantity of 60 capsules, with storage instructions and a caution to keep out of reach of children. Manufactured by Hunanewell PuraCan Pharmaceutical in Wuhan, China, the label includes dosage and handling details along with NDC 42806-569-60.*
FDA Label Image

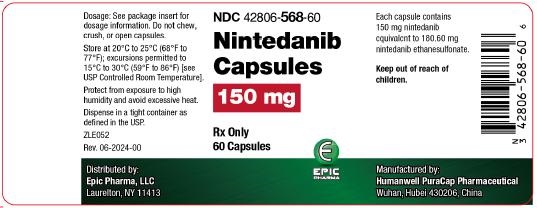
Container-150-60-jpg (150mg 60ct Container)

Container-150-60-jpg (150mg 60ct Container)
Nintedanib Capsules 150 mg oral capsules label showing 60 capsules per container by Epic Pharma LLC. The label includes dosage instructions, storage conditions (20°C to 25°C with excursions permitted), and warnings to avoid chewing, crushing, or opening capsules. Manufactured by Humanwell PuraCap Pharmaceutical in Wuhan, China. The label features branding logos and handling precautions.*
FDA Label Image

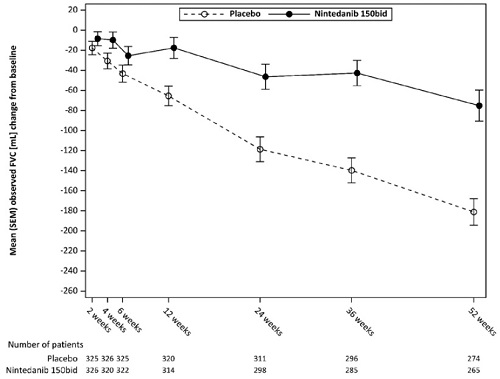
Figure-01.jpg (Figure 01)

Figure-01.jpg (Figure 01)
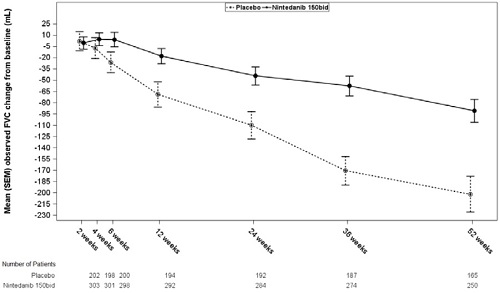
A line graph showing the mean change in observed FVC (forced vital capacity) from baseline (in mL) over a 52-week period, comparing placebo and nintedanib 150 mg capsules. The x-axis represents time points from 2 weeks to 52 weeks, and the y-axis shows the mean change in FVC with error bars indicating SEM. Patient numbers for each group at each time point are listed below the graph.*
FDA Label Image

Figure-02.jpg (Figure 02)

Figure-02.jpg (Figure 02)
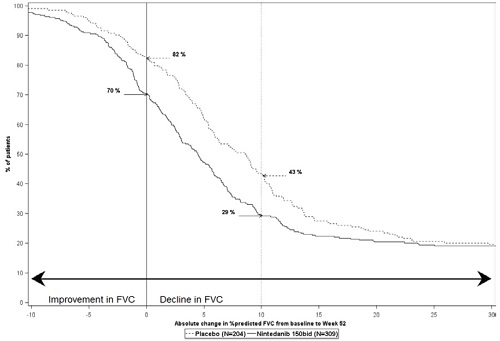
A line graph comparing the percentage of patients showing improvement or decline in forced vital capacity (FVC) over 52 weeks between placebo and nintedanib 150 mg groups. The graph shows a higher percentage of patients with improvement in FVC for nintedanib compared to placebo and a lower percentage with decline in FVC for nintedanib relative to placebo.*
FDA Label Image

Figure-03.jpg (Figure 03)

Figure-03.jpg (Figure 03)
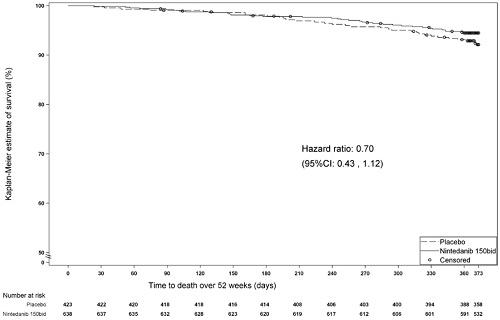
A Kaplan-Meier survival curve chart displaying the estimate of survival percentage over time up to 52 weeks for placebo and Nintedanib 150 mg twice daily. The chart includes a hazard ratio of 0.70 with a 95% confidence interval of 0.43 to 1.12. The x-axis represents time to death in days, and the y-axis shows the survival percentage.*
FDA Label Image

Figure-04.jpg (Figure 04)

Figure-04.jpg (Figure 04)
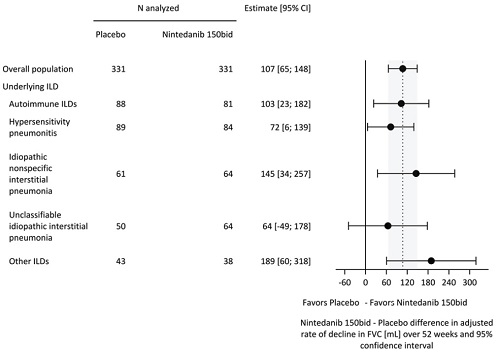
A forest plot comparing the effect of Nintedanib 150 mg twice daily versus placebo across various interstitial lung disease (ILD) subpopulations. The graph shows point estimates with 95% confidence intervals for overall population, autoimmune ILDs, hypersensitivity pneumonitis, idiopathic nonspecific interstitial pneumonia, unclassifiable idiopathic interstitial pneumonia, and other ILDs, illustrating the differences favoring either placebo or Nintedanib.*
FDA Label Image

Figure-05.jpg (Figure 05)

Figure-05.jpg (Figure 05)
A line graph showing the mean observed FVC (mL) change from baseline over time for placebo and nintedanib 150 mg twice daily (bid) groups. The x-axis represents time points from 4 to 52 weeks, and the y-axis shows the change in FVC in milliliters. The graph includes error bars indicating SEM, with placebo showing a greater decline in FVC over time compared to nintedanib 150 mg bid. Patient numbers for each group at different time points are listed below the graph.*
FDA Label Image

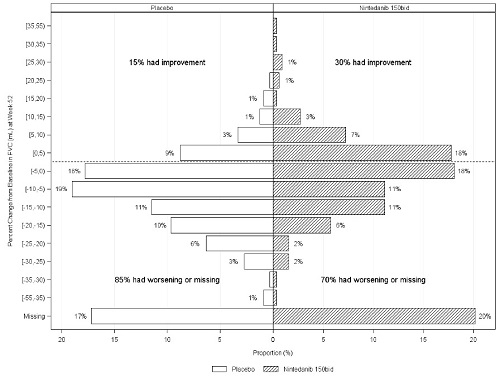
Figure-06.jpg (Figure 06)

Figure-06.jpg (Figure 06)
A horizontal bar chart comparing placebo and nintedanib 150 mg oral capsule groups by percent change from baseline in FVC (mL) categorized by range of change. The chart shows proportions of patients with varying degrees of improvement or worsening, including specific percentages for improvement, worsening, and missing data for both groups.*
FDA Label Image

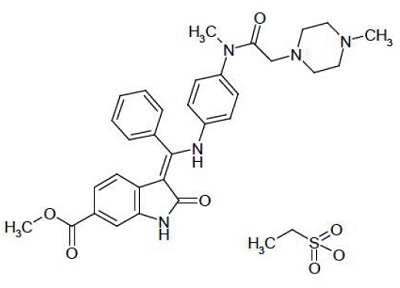
Structure-formula.jpg (Structure Formula)

Structure-formula.jpg (Structure Formula)
Chemical structure of nintedanib showing its molecular framework with multiple aromatic rings, amide, and other functional groups. This diagram represents the active ingredient in the oral capsule formulation by EPIC PHARMA LLC at strengths of 100 mg and 150 mg.*

* About these descriptions: Image descriptions on this page are generated by automated AI analysis of the product label images from the manufacturer's FDA label submission (SPL). They are provided for reference only and may contain errors or omissions. Always rely on the printed label itself and the official FDA labeling, and consult a pharmacist or healthcare professional with any questions about this product.