Product Images Gabapentin

View Photos of Packaging, Labels & Appearance

Product Label Images

The following 6 images provide visual information about the product associated with Gabapentin NDC 43063-673 by Pd-rx Pharmaceuticals, Inc., such as packaging, labeling, and the appearance of the drug itself. This resource could be helpful for medical professionals, pharmacists, and patients seeking to verify medication information and ensure they have the correct product.

43063673 - 43063673

43063673 - 43063673

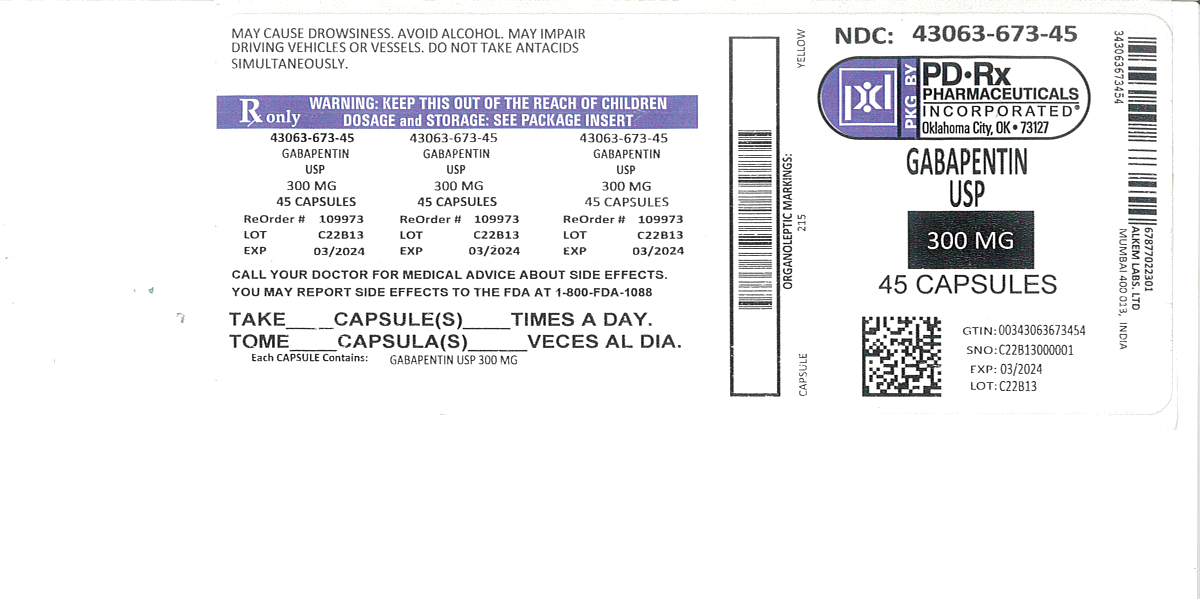
This is a medication called Gabapentin, which comes in a bottle containing 45 capsules of 300mg each. The medication may cause drowsiness and impair driving, so it should not be taken with alcohol. The user should consult the package insert for dosage and storage instructions, and should not take antacids simultaneously. Children should not have access to it. The user may report side effects to the FDA, and should call their doctor for medical advice about side effects. The medication has an expiration date of 03/2024. The GTIN is 00343063673454 and the SNO is C22B13000001. The has missed most of the words, making it difficult to read, but it seems that no additional information is available.*

gabapentin-equation - gabapentin equation

gabapentin-equation - gabapentin equation

gabapentin-fig1 - gabapentin fig1

gabapentin-fig1 - gabapentin fig1

This appears to be a chart or graph showing the mean pain scores for a study that involved a 4-week dose titration period followed by a 4-week fixed dose period. There are two groups, one receiving placebo and the other receiving 3600 mg/day of gabapentin. The baseline score is not provided.*

gabapentin-fig2 - gabapentin fig2

gabapentin-fig2 - gabapentin fig2

This is a chart or table displaying mean pain scores for different groups of patients at different stages of treatment. It shows four groups: placebo, gabapentin 1800 mg/day, gabapentin 2400 mg/day, and a titration period. The titration period appears to have been followed by a fixed dose period. The chart shows the mean pain scores at baseline and at some point during the weeks of treatment.*

gabapentin-fig3 - gabapentin fig3

gabapentin-fig3 - gabapentin fig3

The text is describing a figure showing the proportion of responders in controlled PHN (postherpetic neuralgia) studies. The figure shows different percentages (ranging from 10% to 100%) of responders who experienced a 50% reduction in pain score at the endpoint. The text also shows the results of different studies and the amount of GBP (presumably a medication) administered in each study. There are some statistical symbols such as "#p<00l < 0,001" which suggest that the results may be statistically significant.*

gabapentin-fig4 - gabapentin fig4

gabapentin-fig4 - gabapentin fig4

* The product label images have been analyzed using a combination of traditional computing and machine learning techniques. It should be noted that the descriptions provided may not be entirely accurate as they are experimental in nature. Use the information in this page at your own discretion and risk.