Topiramate Tablet
Product Images NDC 43063-734

View Photos of Packaging, Regulatory Labels, and Product Appearance

Product Visual Gallery

This gallery contains 4 technical images submitted to the FDA as part of the official labeling for Topiramate (NDC 43063-734). Unlike standard consumer photos, these assets often include clinical data figures, molecular chemical structures, and official manufacturer packaging layouts.

As provided by Pd-rx Pharmaceuticals, Inc., these visuals offer a comprehensive scientific overview of the product's physical and chemical identity, aiding pharmacists and researchers in product verification and study.

FDA Label Image

43063734 Label (43063734)
43063734 Label (43063734)
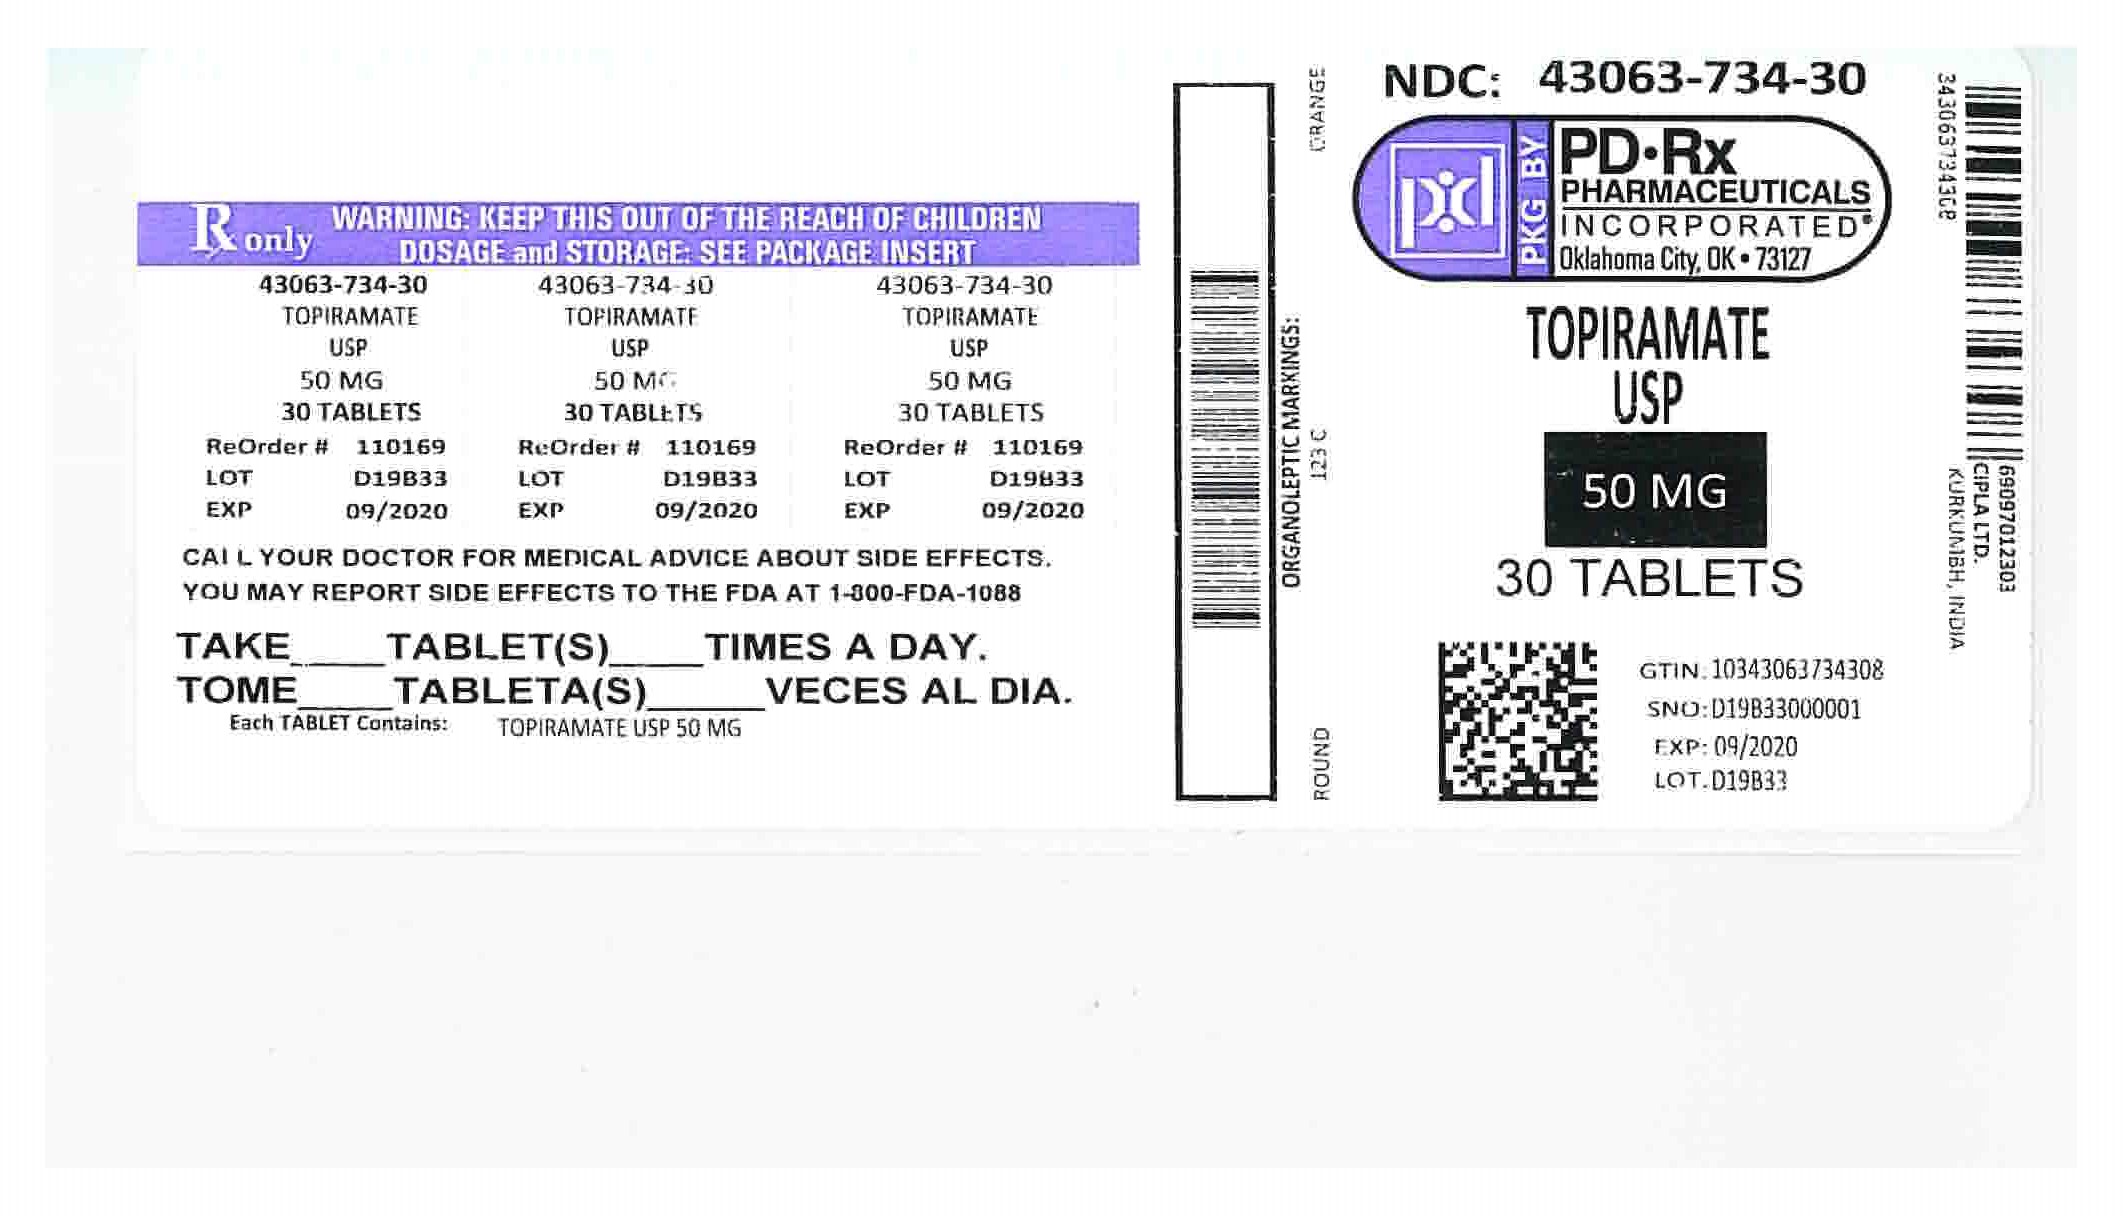
Topiramate USP 50 mg oral tablets label with a 30-tablet count, NDC 43063-734-30, from PD-Rx Pharmaceuticals, Inc. The label includes the lot number D19B33, expiration date 09/2020, and reorder number 110169. It features warnings to keep out of reach of children, dosing instructions blanks, and an FDA side effects reporting number. The label also has a barcode, QR code, and manufacturing information from Cipla Ltd, India.*
FDA Label Image

Ccb7a1e4 A3a1 4a0e 8eb0 8086f53e314b 01

Ccb7a1e4 A3a1 4a0e 8eb0 8086f53e314b 01
Chemical structure of Topiramate, showing its molecular arrangement with multiple oxygen atoms, methyl groups, and a sulfonamide group.*
FDA Label Image

Ccb7a1e4 A3a1 4a0e 8eb0 8086f53e314b 02

Ccb7a1e4 A3a1 4a0e 8eb0 8086f53e314b 02
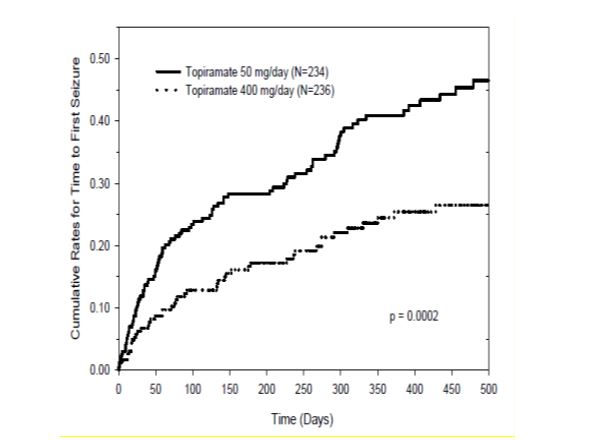
A cumulative rate plot showing time to first seizure comparing Topiramate 50 mg/day and Topiramate 400 mg/day over approximately 500 days. The solid line represents 50 mg/day (N=234) and the dotted line represents 400 mg/day (N=236), with the 400 mg/day dose showing a lower cumulative seizure rate. The chart includes a p-value of 0.0002 indicating statistical significance.*
FDA Label Image

Ccb7a1e4 A3a1 4a0e 8eb0 8086f53e314b 03

Ccb7a1e4 A3a1 4a0e 8eb0 8086f53e314b 03
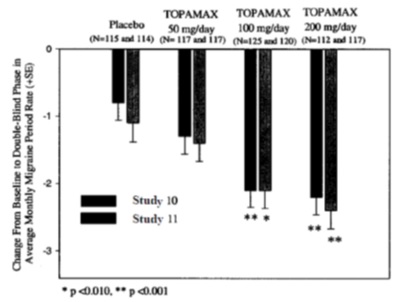
A bar chart comparing the change from baseline to double-blind phase in average monthly migraine period rate across different treatment groups: Placebo, Topamax 50 mg/day, 100 mg/day, and 200 mg/day. The chart shows data from two studies (Study 10 and Study 11), with bars representing mean changes and error bars indicating variability. Statistical significance markers (* p<0.010, ** p<0.001) are shown for higher Topamax dosages compared to placebo.*

* About these descriptions: Image descriptions on this page are generated by automated AI analysis of the product label images from the manufacturer's FDA label submission (SPL). They are provided for reference only and may contain errors or omissions. Always rely on the printed label itself and the official FDA labeling, and consult a pharmacist or healthcare professional with any questions about this product.