Product Images Duloxetine

View Photos of Packaging, Labels & Appearance

Product Label Images

The following 11 images provide visual information about the product associated with Duloxetine NDC 43063-877 by Pd-rx Pharmaceuticals, Inc., such as packaging, labeling, and the appearance of the drug itself. This resource could be helpful for medical professionals, pharmacists, and patients seeking to verify medication information and ensure they have the correct product.

image - 43063877

image - 43063877

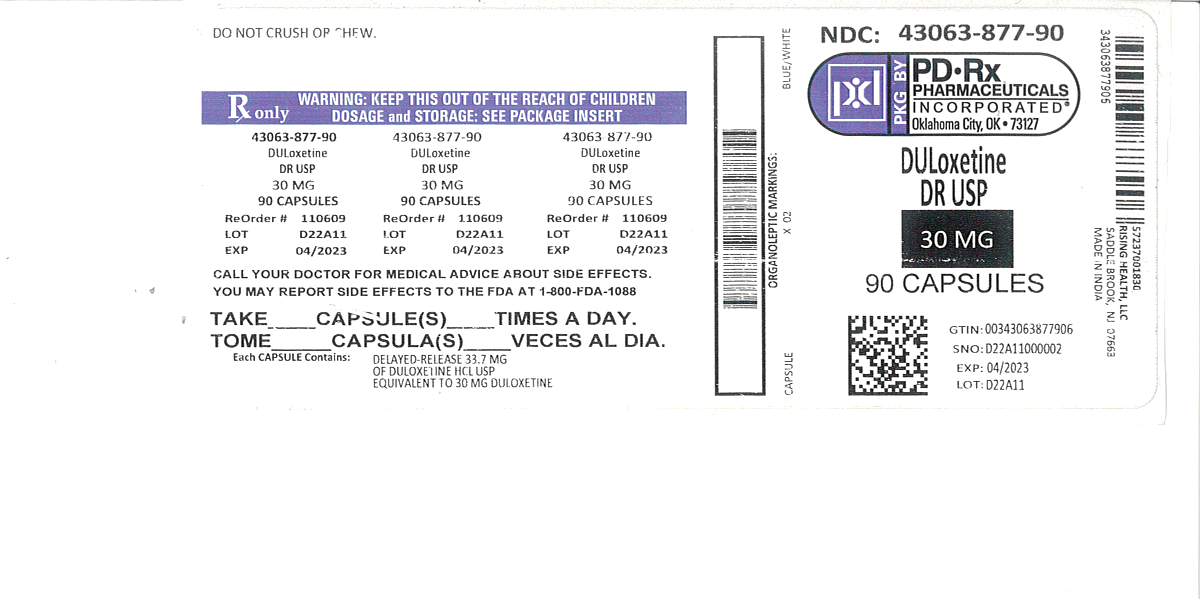
This is a medication package for a drug called Duloxetine. It contains 90 capsules, each with 30mg of Duloxetine. The medication is made by a company called Blue Pharmaceuticals, located in Oklahoma City. The package has a warning to keep the medication out of reach of children, and instructions for dosage and storage can be found in the package insert. The medication is delayed-release and each capsule contains 33mg of Duloxetine HCl USP. There is also information about potential side effects and a number to call to report them to the FDA.*

Figure 1: Kaplan-Meier Estimation of Cumulative Proportion of Patients with Relapse (MDD Study 5) - duloxetine fig1

Figure 1: Kaplan-Meier Estimation of Cumulative Proportion of Patients with Relapse (MDD Study 5) - duloxetine fig1

fig2 - duloxetine fig2

fig2 - duloxetine fig2

Figure 3: Percentage of Patients Achieving Various Levels of Pain Relief as Measured by 24-Hour Average Pain Severity - DPNP-1 - duloxetine fig3

Figure 3: Percentage of Patients Achieving Various Levels of Pain Relief as Measured by 24-Hour Average Pain Severity - DPNP-1 - duloxetine fig3

Figure 4: Percentage of Patients Achieving Various Levels of Pain Relief as Measured by 24-Hour Average Pain Severity - DPNP-2 - duloxetine fig4

Figure 4: Percentage of Patients Achieving Various Levels of Pain Relief as Measured by 24-Hour Average Pain Severity - DPNP-2 - duloxetine fig4

Figure 7: Percentage of Patients Achieving Various Levels of Pain Relief as Measured by 24-Hour Average Pain Severity – CLBP-1 - duloxetine fig5

Figure 7: Percentage of Patients Achieving Various Levels of Pain Relief as Measured by 24-Hour Average Pain Severity – CLBP-1 - duloxetine fig5

The text depicts a graph showing the percentage of patients whose pain improved from baseline, with different levels of improvement indicated on the Y-axis ranging from 10% to 80%. The X-axis shows the percent improvement in pain, with increments of 10%, ranging from zero to 100%. The graph compares the effects of duloxetine administered twice daily versus once daily, as well as a placebo control group. The percentage of patients who experienced improvement was highest with duloxetine 60mg twice daily, followed by once daily, with the placebo group having the lowest percentage of patients who experienced improvement.*

Figure 8: Percentage of Patients Achieving Various Levels of Pain Relief as Measured by 24-Hour Average Pain Severity – CLBP-3 - duloxetine fig6

Figure 8: Percentage of Patients Achieving Various Levels of Pain Relief as Measured by 24-Hour Average Pain Severity – CLBP-3 - duloxetine fig6

This is a chart showing improvement in pain from baseline for patients taking different doses of Duloxetine and placebo. The x-axis shows the percentage of improvement in pain, and the y-axis shows the various doses of Duloxetine and placebo. The chart appears to be part of a research study evaluating the effectiveness of Duloxetine in treating pain.*

Figure 9: Percentage of Patients Achieving Various Levels of Pain Relief as Measured by 24-Hour Average Pain Severity – OA-1 - duloxetine fig7

Figure 9: Percentage of Patients Achieving Various Levels of Pain Relief as Measured by 24-Hour Average Pain Severity – OA-1 - duloxetine fig7

The given text represents a graph or chart showing the percentage of patients improved in the placebo group and the Duloxetine 60/120 mg once group. The X-axis of the graph ranges from 0 to 100, while the Y-axis denotes the percentage of patients in the groups. The graph also shows the percentage improvement in pain from baseline (BOCF). Therefore, this text provides a statistical representation of the effectiveness of Duloxetine in comparison to the Placebo.*

duloxetine fig8

duloxetine fig8

duloxetine fig9

duloxetine fig9

This text appears to be a chart or graph showing the percentage of pain improvement for patients taking a medication called Placeto and Duloxetine at doses of 60/120 mg once daily. The percent improvement in pain is plotted against a baseline value. There is not enough information given to determine the scale or meaning of the X-axis values.*

Structure - duloxetine str

Structure - duloxetine str

* The product label images have been analyzed using a combination of traditional computing and machine learning techniques. It should be noted that the descriptions provided may not be entirely accurate as they are experimental in nature. Use the information in this page at your own discretion and risk.