Tamsulosin Hydrochloride Capsule
Product Images NDC 43063-947

View Photos of Packaging, Regulatory Labels, and Product Appearance

Product Visual Gallery

This gallery contains 7 technical images submitted to the FDA as part of the official labeling for Tamsulosin Hydrochloride (NDC 43063-947). Unlike standard consumer photos, these assets often include clinical data figures, molecular chemical structures, and official manufacturer packaging layouts.

As provided by Pd-rx Pharmaceuticals, Inc., these visuals offer a comprehensive scientific overview of the product's physical and chemical identity, aiding pharmacists and researchers in product verification and study.

FDA Label Image

43063947 Label (43063947)

43063947 Label (43063947)
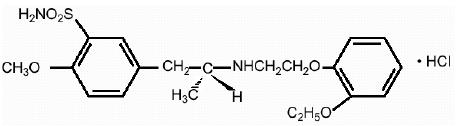
This is a description of a medication called Tamsulosin, which comes in the form of capsules containing 0.4mg of Tamsulosin Hydrochloride. It is packaged in bottles of 30 capsules with the product code 43063-947-30 and lot number c22685, with expiration date 03/2024. Patients are instructed to take this medication as directed by their doctor and may experience side effects that can be reported to the FDA at 1-800-FDA-1088. The labeling of the capsule is green/orange with the text "053" and the company responsible for the manufacturing of the product is HCLUSP Pharmaceuticals Incorporated.*
FDA Label Image

Figure 1 Mean Plasma Tamsulosin Hydrochloride Concentrations Following Single-dose Administration Of Tamsulosin Hydrochloride Capsules 0.4 mg Under Fasted And Fed Conditions (n=8) (Tamsulosin Fig1)

Figure 1 Mean Plasma Tamsulosin Hydrochloride Concentrations Following Single-dose Administration Of Tamsulosin Hydrochloride Capsules 0.4 mg Under Fasted And Fed Conditions (n=8) (Tamsulosin Fig1)
The figure shows the mean plasma concentration of Tamsulosin Hydrochloride after administration of a single dose of 0.4mg capsules under fasted and fed conditions. The x-axis represents time in hours, while the y-axis indicates the mean plasma concentration of the drug. There are two lines representing the fasted and fed conditions, respectively. The graph provides a visual representation of how the absorption of Tamsulosin Hydrochloride varies depending on whether it was taken on an empty stomach or with a meal.*
FDA Label Image

Figure 2a Mean Change From Baseline In Total Aua Symptom Score (0 To 35) Study 1 (Tamsulosin Fig2)

Figure 2a Mean Change From Baseline In Total Aua Symptom Score (0 To 35) Study 1 (Tamsulosin Fig2)
This is a figure labeled "Figure 2A" that shows the mean change from baseline in the total AUA symptom score (on a scale of 0 to 35) in Study 1. The figure shows the results for two treatments: a treatment with a dosage of -OO-0-08mg_~A= A -A04my_ O30 and a placebo. The x-axis shows the duration of treatment in weeks and the y-axis shows the mean change in score. There are data points for various time points ranging from 0 to 13 weeks. The graph shows that the treatment group had a greater reduction in symptom score compared to the placebo group.*
FDA Label Image

Figure 2b Mean Change From Baseline In Total Aua Symptom Score (0 To 35) Study 2 (Tamsulosin Fig3)

Figure 2b Mean Change From Baseline In Total Aua Symptom Score (0 To 35) Study 2 (Tamsulosin Fig3)
This is a figure showing the mean change from baseline in total American Urological Association symptom score for Study 2, represented by different treatments including O=0O—0-08mg LNt, 0.4mg, and Placebo over a duration of 0, 1, 2, 5, 9, 13 weeks. There are no identifiable non-English characters.*
FDA Label Image

Figure 3a Mean Increase In Peak Urine Flow Rate (ml/sec) Study 1 (Tamsulosin Fig4)

FDA Label Image

Figure 3b Mean Increase In Peak Urine Flow Rate (ml/sec) Study 2 (Tamsulosin Fig5)

Figure 3b Mean Increase In Peak Urine Flow Rate (ml/sec) Study 2 (Tamsulosin Fig5)
The text describes a graph showing the mean increase in peak urine flow rate (measured in mL/Sec) during a study, labeled as "Study 2", with different treatment durations (measured in weeks) on the X-axis. The graph has a line plot labeled "20 Treatment" and data points ranging from 0 to 6. The text is not sufficient to determine what the study was about or what treatments were used.*
FDA Label Image

Chemical Structure (Tamsulosin Str)

* These product label images have been analyzed using experimental machine learning. Please verify findings with the primary label text.