Product Images Sildenafil

View Photos of Packaging, Labels & Appearance

Product Label Images

The following 9 images provide visual information about the product associated with Sildenafil NDC 43063-982 by Pd-rx Pharmaceuticals, Inc., such as packaging, labeling, and the appearance of the drug itself. This resource could be helpful for medical professionals, pharmacists, and patients seeking to verify medication information and ensure they have the correct product.

43063982 LABEL - 43063982

43063982 LABEL - 43063982

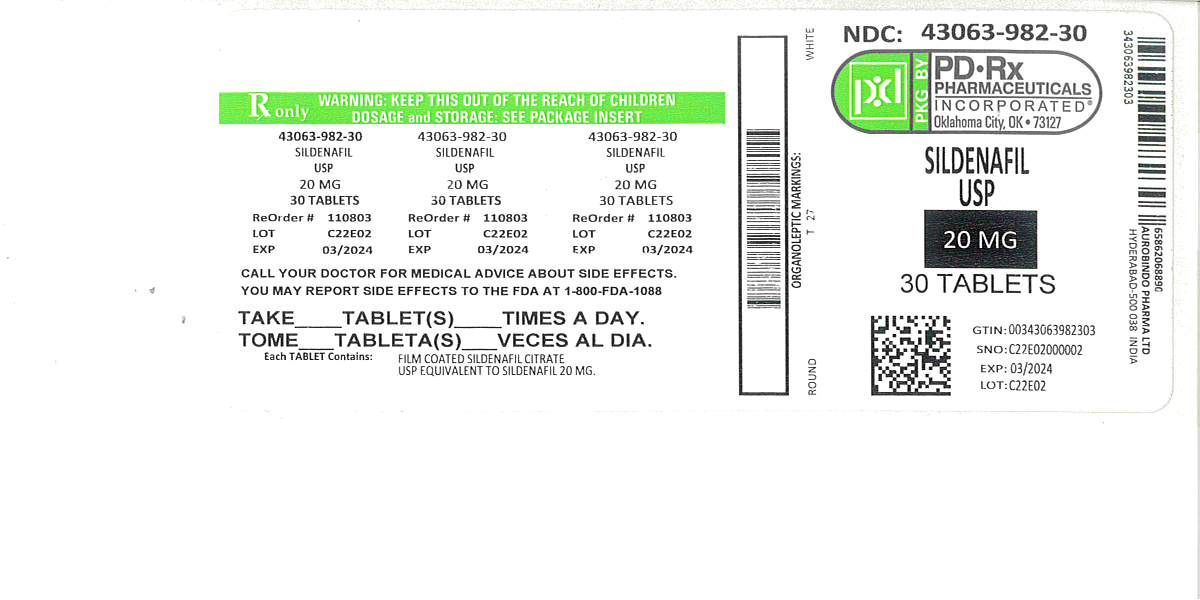
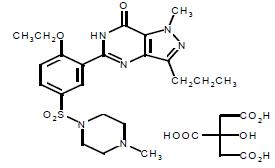
This is a medication information sheet for Sildenafil, a drug that comes in 20mg tablets and is used to treat certain types of erectile dysfunction in men. The text includes details about the product, such as the lot number, expiration date, and dosage instructions. It also gives a warning about potential side effects and provides an FDA contact number for reporting them. The text also contains some technical information for pharmacists, including the NDC number and the drug's chemical makeup.*

Figure 6: Kaplan-Meier Plot of Mortality by Sildenafil Dose - sildenafil fig1

Figure 6: Kaplan-Meier Plot of Mortality by Sildenafil Dose - sildenafil fig1

This appears to be a chart showing the estimated cumulative mortality rate given different doses of some substance over time in years. The rates are given in percentages and high, medium, and low doses are compared.*

Figure 7. Effects of Other Drugs on Sildenafil Pharmacokinetics - sildenafil fig2

Figure 7. Effects of Other Drugs on Sildenafil Pharmacokinetics - sildenafil fig2

This text appears to be a chart or table that provides recommendations for dose adjustments of different drugs when administered with Sildenafil. The chart includes drug names, specific measurements such as AUC (area under the curve) and Cmax (maximum plasma concentration), and whether a dose adjustment is recommended or not for each drug when taken with Sildenafil. Additionally, it includes some notes about the clinical studies, the lack of benefit on exercise capacity when sildenafil added to bosentan therapy, and a line graph depicting the change relative to Sildenafil alone.*

Figure 8 Effects of Sildenafil on Other Drugs - sildenafil fig3

Figure 8 Effects of Sildenafil on Other Drugs - sildenafil fig3

This is a list of interacting drugs with Acenocoumarol. The data presented includes the effects on different parameters, such as INR, AUC, Cmax and BT, as well as recommendations on dose adjustments. No adjustments are needed for most drugs, but coadministration with some drugs is not recommended. The effect of ritonavir on sildenafil PK is also described.*

Figure 9. Change from Baseline in 6-Minute Walk Distance (meters) at Weeks 4, 8, and 12 in Study 1: Mean (95% Confidence Interval) - sildenafil fig4

Figure 9.  Change from Baseline in 6-Minute Walk Distance (meters) at Weeks 4, 8, and 12 in Study 1: Mean (95% Confidence Interval) - sildenafil fig4

This is a graphical representation of the change from baseline in 6-minute walk distance in a study that evaluated a placebo and two doses of sildenafil (40mg and 80mg) at weeks 4, 8, and 12. The mean and 95% confidence intervals are shown in meters. No useful information can be extracted from the output provided.*

Figure 10. Placebo-Corrected Change From Baseline in 6-Minute Walk Distance (meters) at Week 12 by study subpopulation in Study 1: Mean (95% Confidence Interval) - sildenafil fig5

Figure 10.  Placebo-Corrected Change From Baseline in 6-Minute Walk Distance (meters) at Week 12 by study subpopulation in Study 1: Mean (95% Confidence Interval) - sildenafil fig5

This is a statistical graph showing the placebo-corrected change from baseline in 6-minute walk distance (meters) at week 12 by study subpopulation in Study 1. The graph displays mean values with a 95% confidence interval. There are several categories of the subpopulation, including idiopathicPAH, etiology PHCD, PAH-surgical repair, PH etiology for functional capacity, and therapeutic class. There are also details given for baseline walk and distance (in meters), the number of people in each subpopulation group, median age, mean PAP, and PR. The x-axis is the Placebo-corrected Change in 6-Minute Walk Distance (m), while the y-axis is the study subpopulation.*

Figure 11. Kaplan-Meier Plot of Time (in Days) to Clinical Worsening of PAH in Study 2 - sildenafil fig6

Figure 11. Kaplan-Meier Plot of Time (in Days) to Clinical Worsening of PAH in Study 2 - sildenafil fig6

The text describes a Kaplan-Meier plot that displays the time (in days) to clinical worsening of PAH in Study 2. The x-axis represents the days from randomization, and the y-axis represents the percentage without a clinically worsening event. The plot compares two interventions, Placebo, and Sildenafil. The description does not provide any further information or context regarding Study 2 or the interventions used.*

Figure 12. Mean Change from Baseline in Six Minute Walk (meters) by Visit to Week 12 – ITT Population Sildenafil Protocol A1481244 - sildenafil fig7

Figure 12. Mean Change from Baseline in Six Minute Walk (meters) by Visit to Week 12 – ITT Population Sildenafil Protocol A1481244 - sildenafil fig7

The text contains data related to a study analyzing the mean change from baseline for different treatments over a period of 12 weeks. The treatments mentioned are Sidenafil in different doses (5mgTD, 20mg TID). However, the text is not complete and does not provide sufficient information to understand the study in detail.*

Chemical Structure - sildenafil str

Chemical Structure - sildenafil str

* The product label images have been analyzed using a combination of traditional computing and machine learning techniques. It should be noted that the descriptions provided may not be entirely accurate as they are experimental in nature. Use the information in this page at your own discretion and risk.