Product Images Atorvastatin Calcium

View Photos of Packaging, Labels & Appearance

Product Label Images

The following 6 images provide visual information about the product associated with Atorvastatin Calcium NDC 43353-115 by Aphena Pharma Solutions - Tennessee, Llc, such as packaging, labeling, and the appearance of the drug itself. This resource could be helpful for medical professionals, pharmacists, and patients seeking to verify medication information and ensure they have the correct product.

Bottle Label 10mg - 43353 0115 45

Bottle Label 10mg - 43353 0115 45

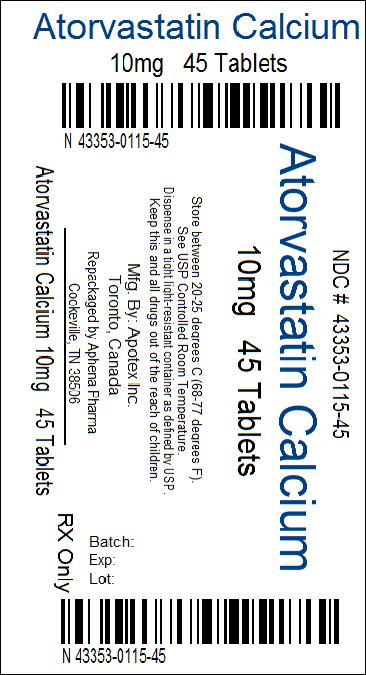
Atorvastatin Calcium is a medication presented in the form of 45 tablets of 10mg each. It is labeled with an NDC number of 43353-0115-45 and instructions to store between 20-25 degrees Celsius. It appears to be repackaged by Aphena Pharma in Cockeville, TN with a reference to Toronto, Canada.*

Aphena Pharma Solutions - TN - Aphena

Aphena Pharma Solutions - TN - Aphena

Chemical Structure- Atorvastatin Calcium - image 01

Chemical Structure- Atorvastatin Calcium - image 01

Figure 1 - image 02

Figure 1 - image 02

Figure 2 - image 03

Figure 2 - image 03

The text represents a cumulative hazard curve showing the percentage of participants experiencing the primary endpoint over 4 years of follow-up. The curve compares the placebo group to the group treated with Atorvastatin. The hazard ratio (HR) between the two groups is 0.63 with a confidence interval from 0.48 to 0.83 (p=0.001). The x-axis of the graph shows the time to the first primary endpoint (in years).*

Figure 3 - image 04

Figure 3 - image 04

This text shows data from a study comparing the effectiveness of two different doses of Atorvastatin in reducing the occurrence of major cardiovascular events over four years. The percentage of subjects who experienced such an event is not stated clearly, but it appears to be very low based on the numbers given. The higher dose of Atorvastatin was associated with a significantly lower risk of experiencing a cardiovascular event (HR 0.78, p=0.0002). The graph shows the time to the first major cardiovascular event over four years.*

* The product label images have been analyzed using a combination of traditional computing and machine learning techniques. It should be noted that the descriptions provided may not be entirely accurate as they are experimental in nature. Use the information in this page at your own discretion and risk.