Depakote
Product Images NDC 43353-310

6 FDA label images from Aphena Pharma Solutions - Tennessee, Llc · Packaging, Regulatory Labels, and Product Appearance

Product Visual Gallery

This gallery contains 6 technical images submitted to the FDA as part of the official labeling for Depakote (NDC 43353-310). Unlike standard consumer photos, these assets often include clinical data figures, molecular chemical structures, and official manufacturer packaging layouts.

As provided by Aphena Pharma Solutions - Tennessee, Llc, these visuals offer a comprehensive scientific overview of the product's physical and chemical identity, aiding pharmacists and researchers in product verification and study.

FDA Label Image

Bottle Label 500mg (43353 310)

Bottle Label 500mg (43353 310)
Label for Depakote ER (Divalproex NA) 500 mg tablets, containing 60 tablets per bottle. The label includes storage instructions, manufacturer AbbVie LTD in Barceloneta, PR, and repackager Aphena Pharma Solutions - Tennessee, LLC in Cookeville, TN. This prescription medication label notes storage at controlled room temperature and safety warnings for keeping out of reach of children.*
FDA Label Image

Aphena Pharma Solutions (TN)

FDA Label Image

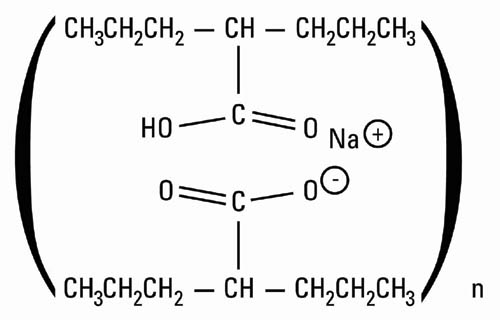
Chemical Structure Of Divalproex Sodium (Depakote Er 01)

Chemical Structure Of Divalproex Sodium (Depakote Er 01)
Chemical structure of the active ingredient depicted by the molecular formula shown in the image, featuring sodium and various hydrocarbon groups, consistent with a chemical representation for a pharmaceutical compound.*
FDA Label Image

Figure 3 (Depakote Er 02)

Figure 3 (Depakote Er 02)
A bar chart comparing two groups: Placebo and Depakote ER. The y-axis represents a numeric scale from 0 to 1.2, with the Placebo bar at 0.6 and the Depakote ER bar at 1.2, indicating higher values for Depakote ER. A note indicates statistical significance with p=0.006.*
FDA Label Image

Figure 1 (Depakote Er 03)

Figure 1 (Depakote Er 03)
A cumulative distribution curve chart comparing Depakote and placebo showing percent reduction in CPS rate vs percent of patients. The y-axis represents % reduction in CPS rate from -100% to 100%, while the x-axis shows % of patients from 100% to 0%. The solid line represents Depakote, and the dashed line represents placebo, with improvement indicated upwards and worsening downwards.*
FDA Label Image

Figure 2 (Depakote Er 04)

Figure 2 (Depakote Er 04)
A cumulative percentage chart showing % reduction in CPS rate versus % of patients for High Dose and Low Dose DEPAKOTE. The vertical axis ranges from -100% (worsening) to 100% (improvement), and the horizontal axis shows % of patients from 100 to 0. Solid and dashed lines represent high dose and low dose Depakote respectively, demonstrating patient response distribution.*

* About these descriptions: Image descriptions on this page are generated by automated AI analysis of the product label images from the manufacturer's FDA label submission (SPL). They are provided for reference only and may contain errors or omissions. Always rely on the printed label itself and the official FDA labeling, and consult a pharmacist or healthcare professional with any questions about this product.