Bottle Label 10mg (43353 746 30)
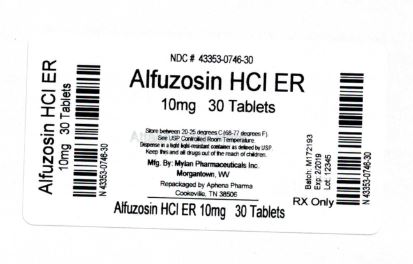
This is a medication called Alfuzosin HCI ER, which comes in a pack of 30 tablets each, with a strength of 10mg. The NOC# 353074630 could be a reference number for the medication.*