Alfuzosin Hydrochloride Tablet, Extended Release
Product Images NDC 43353-945

10 FDA label images from Aphena Pharma Solutions - Tennessee, Llc · Packaging, Regulatory Labels, and Product Appearance

Product Visual Gallery

This gallery contains 10 technical images submitted to the FDA as part of the official labeling for Alfuzosin Hydrochloride (NDC 43353-945). Unlike standard consumer photos, these assets often include clinical data figures, molecular chemical structures, and official manufacturer packaging layouts.

As provided by Aphena Pharma Solutions - Tennessee, Llc, these visuals offer a comprehensive scientific overview of the product's physical and chemical identity, aiding pharmacists and researchers in product verification and study.

FDA Label Image

Bottle Label 10mg (43353 945)

Bottle Label 10mg (43353 945)
Label for Alfuzosin HCl ER 10 mg extended release tablets, containing 30 tablets per package. The label displays the proprietary name, strength, dosage form, quantity, NDC 43353-945-30, and identifies Aphena Pharma Solutions - Tennessee, LLC as the labeler. Directions and warnings are printed in small text.*
FDA Label Image

Aphena Pharma Solutions (TN)

FDA Label Image

Alf4 (Alf4)

Alf4 (Alf4)
A pharmacokinetic line graph showing Alfuzosin plasma concentration (ng/mL) versus time (hours) over a 24-hour period comparing fed and fasted states. The graph displays higher plasma concentrations under fed conditions with peak levels around 8-10 hours, while fasted levels remain lower and more stable throughout the time period.*
FDA Label Image

Dia1 (Dia1)

Dia1 (Dia1)
Chemical structure of Alfuzosin hydrochloride, the active ingredient in the drug Alfuzosin hydrochloride 10 mg extended-release tablet. The structure includes multiple rings, amine, ether, and hydrochloride components.*
FDA Label Image

Dia10 (Dia10)

Dia10 (Dia10)
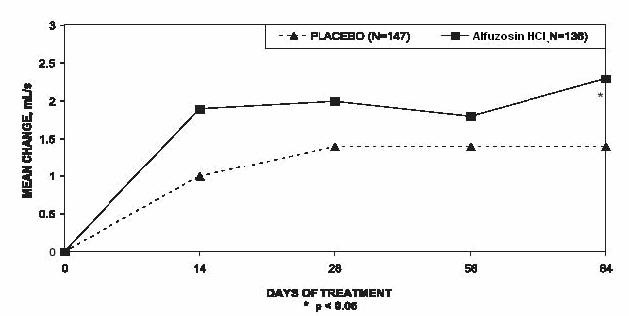
A line graph showing mean change in mL over days of treatment, comparing Alfuzosin hydrochloride to placebo. The x-axis represents days of treatment (0, 14, 28, 56, 84), while the y-axis shows mean change in mL from 0 to 3. Alfuzosin HCl data points trend higher than placebo across the study period, with an asterisk indicating statistical significance at day 84 (p < 0.05).*
FDA Label Image

Dia11 (Dia11)

Dia11 (Dia11)
A line graph comparing mean change in an unspecified variable over days of treatment between placebo (N=150) and Alfuzosin HCl (N=151). The x-axis shows days of treatment (0, 14, 28, 56, 84) and the y-axis shows mean change in mL/s. Alfuzosin HCl demonstrates a higher mean change at each time point compared to placebo. A notation indicates 'NS p > 0.05'.*
FDA Label Image

Dia6 (Dia6)

Dia6 (Dia6)
A line graph comparing the mean change over days of treatment between two groups: Placebo (N=167) and Alfuzosin HCl (N=170). The x-axis represents days of treatment (0, 28, 56, 84), and the y-axis shows the mean change, with Alfuzosin HCl showing a greater decrease compared to placebo. Statistical significance is indicated with p < 0.001.*
FDA Label Image

Dia7 (Dia7)

Dia7 (Dia7)
A line graph comparing median change over days of treatment between placebo and Alfuzosin hydrochloride groups. The x-axis represents days of treatment (0, 28, 56, 84), and the y-axis shows median change, with Alfuzosin HCl showing greater median reduction than placebo by day 84. Statistical significance (p < 0.01) is indicated at day 84.*
FDA Label Image

Dia8 (Dia8)

Dia8 (Dia8)
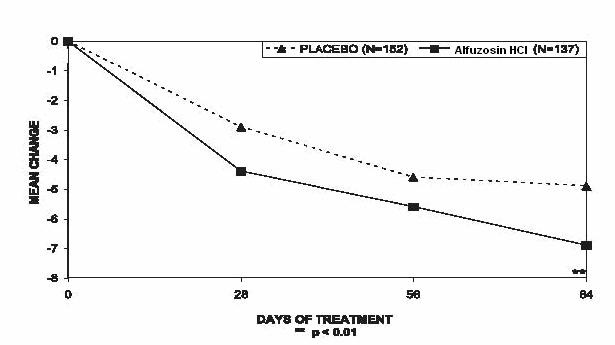
A line graph comparing mean change over days of treatment between a placebo group (N=150) and Alfuzosin HCl group (N=151). The x-axis represents days of treatment (0, 28, 56, 84), and the y-axis shows mean change with values decreasing below zero. Alfuzosin HCl shows a greater decrease in mean change over time compared to placebo. Statistical significance is indicated by p < 0.01.*
FDA Label Image

Dia9 (Dia9)

Dia9 (Dia9)
A line graph showing mean change in mL/s over 84 days of treatment comparing Alfuzosin hydrochloride and placebo. The x-axis represents days of treatment (0, 28, 56, 84), and the y-axis represents mean change in mL/s. Alfuzosin HCl shows a higher increase compared to placebo, with statistically significant differences (p < 0.001) indicated.*

* About these descriptions: Image descriptions on this page are generated by automated AI analysis of the product label images from the manufacturer's FDA label submission (SPL). They are provided for reference only and may contain errors or omissions. Always rely on the printed label itself and the official FDA labeling, and consult a pharmacist or healthcare professional with any questions about this product.