Duloxetine Capsule, Delayed Release
Product Images NDC 43547-381

14 FDA label images from Solco Healthcare Us, Llc · Packaging, Regulatory Labels, and Product Appearance

Product Visual Gallery

This gallery contains 14 technical images submitted to the FDA as part of the official labeling for Duloxetine (NDC 43547-381). Unlike standard consumer photos, these assets often include clinical data figures, molecular chemical structures, and official manufacturer packaging layouts.

As provided by Solco Healthcare Us, Llc, these visuals offer a comprehensive scientific overview of the product's physical and chemical identity, aiding pharmacists and researchers in product verification and study.

FDA Label Image

Chemical Structure (Structure)

Chemical Structure (Structure)
Chemical structure of duloxetine hydrochloride, shown with its bicyclic aromatic ring system, thiophene ring, and secondary amine with methyl substitution.*
FDA Label Image

Image 1 (Image 01)

Image 1 (Image 01)
A line graph depicting the proportion of patients with relapse over time for two treatment groups: Duloxetine and placebo. The x-axis represents time, and the y-axis shows the proportion of patients with relapse. Two lines compare relapse rates, with Duloxetine showing a lower proportion than placebo throughout the observed period.*
FDA Label Image

Image 2 (Image 02)

Image 2 (Image 02)
A Kaplan-Meier curve comparing the proportion of patients with relapse over time (days) following randomization in a clinical study. The graph shows two treatment groups: placebo and duloxetine, with duloxetine having a lower proportion of relapse over approximately 250 days.*
FDA Label Image

Image 3 (Image 03)

Image 3 (Image 03)
A line graph showing the percentage of patients improved plotted against percent improvement in pain from baseline for duloxetine at doses 60 mg BID, 60 mg QD, 20 mg QD, and placebo. Each treatment group is represented by a distinct line pattern and markers illustrating the comparative efficacy in pain improvement.*
FDA Label Image

Image 4 (Image 04)

Image 4 (Image 04)
Line graph showing the percentage of patients improved versus percent improvement in pain from baseline for Duloxetine 60 mg taken twice daily, once daily, and placebo. The graph compares efficacy over a range of pain improvement percentages, with Duloxetine groups showing higher patient improvement rates than placebo.*
FDA Label Image

Image 5 (Image 05)

Image 5 (Image 05)
A line graph comparing percent improvement in pain from baseline with Duloxetine 60mg twice daily, Duloxetine 60mg once daily, and placebo groups. The x-axis shows percent improvement in pain from 0 to 100%, and the y-axis shows percentage of patients improved from 0 to 100%. The graph shows higher patient improvement percentages for Duloxetine groups compared to placebo across the range.*
FDA Label Image

Image 6 (Image 06)

Image 6 (Image 06)
A line graph depicting the percentage of patients who improved with varying percent improvement in pain from baseline. The graph compares Duloxetine at 120 mg once daily, 60 mg once daily, 20 mg once daily, and placebo groups. The y-axis shows the percentage of patients improved, and the x-axis shows the percent improvement in pain from baseline.*
FDA Label Image

Image7 (Image 10)

Image7 (Image 10)
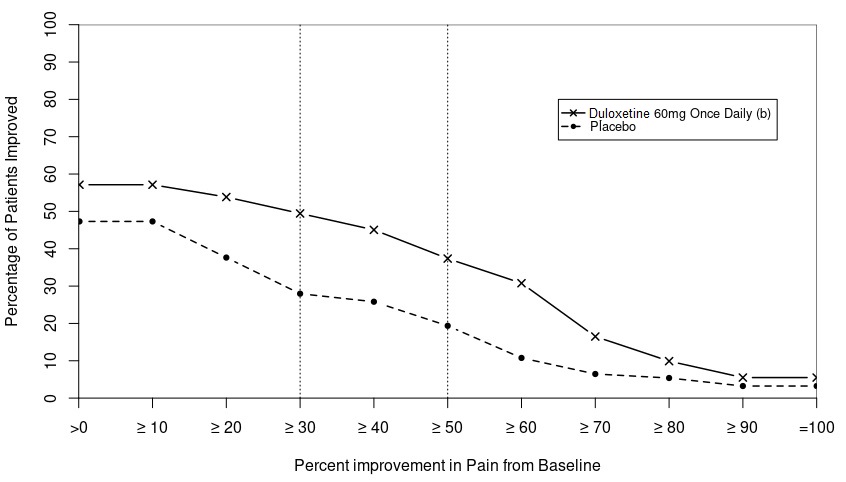
A line graph comparing the percentage of patients improved in pain from baseline between Duloxetine 60 mg once daily and placebo. The x-axis shows percent improvement in pain from baseline, ranging from greater than 0 to 100. The y-axis shows the percentage of patients improved, from 0 to 100%.*
FDA Label Image

Image 7 (Image 07)

Image 7 (Image 07)
A line graph comparing the percentage of patients improved versus percent improvement in pain from baseline (BOCF) for Duloxetine 60/120 mg once daily and placebo. The x-axis represents percent improvement in pain, and the y-axis shows the percentage of patients improved. The graph includes two lines, one for each treatment group, showing patient response trends over increasing pain improvement thresholds.*
FDA Label Image

Image 8 (Image 08)

Image 8 (Image 08)
A line graph comparing the percentage of patients improved in pain from baseline (BOCF) over increasing percent improvement thresholds for placebo and duloxetine 60 mg once daily. The x-axis represents percent improvement in pain, and the y-axis shows the percentage of patients improved. Two lines illustrate patients' response rates to placebo and duloxetine treatment across different improvement levels.*
FDA Label Image

Image 9 (Image 09)

Image 9 (Image 09)
A line chart comparing the percentage of patients improved versus percent improvement in pain from baseline (BOCF) between Duloxetine 60/120 mg once daily and placebo groups. Duloxetine shows higher patient improvement percentages at most pain improvement thresholds.*
FDA Label Image

20mg-zht (Image 11)

20mg-zht (Image 11)
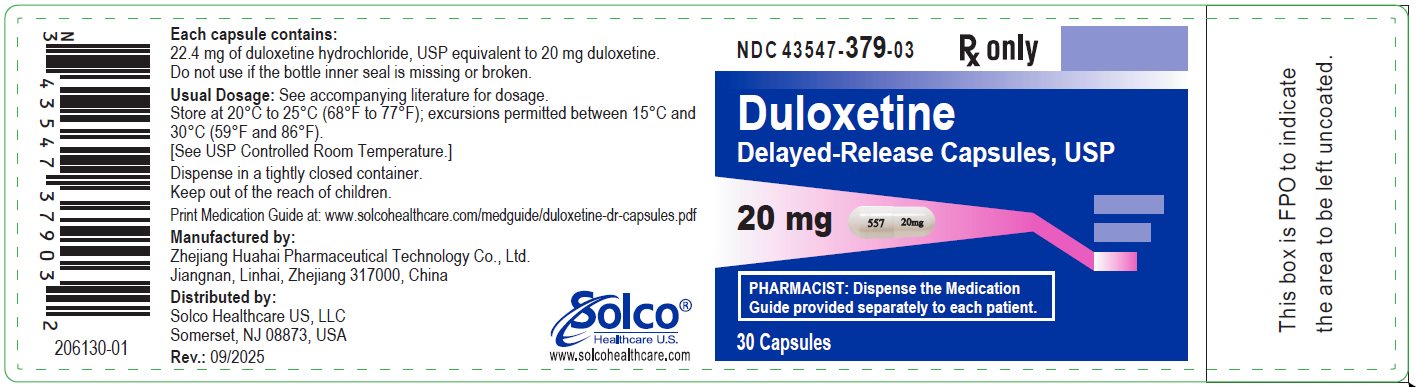
DULOXETINE 20 mg delayed-release capsules label from Solco Healthcare US, LLC. The label highlights the active ingredient duloxetine hydrochloride equivalent to 20 mg duloxetine per capsule. It includes a capsule illustration marked 557 and 20 mg. The package contains 30 capsules and instructs pharmacists to dispense the Medication Guide with each prescription. Manufacturer and distributor information is present, along with storage and dosage guidance.*
FDA Label Image

30ng-zht (Image 12)

30ng-zht (Image 12)
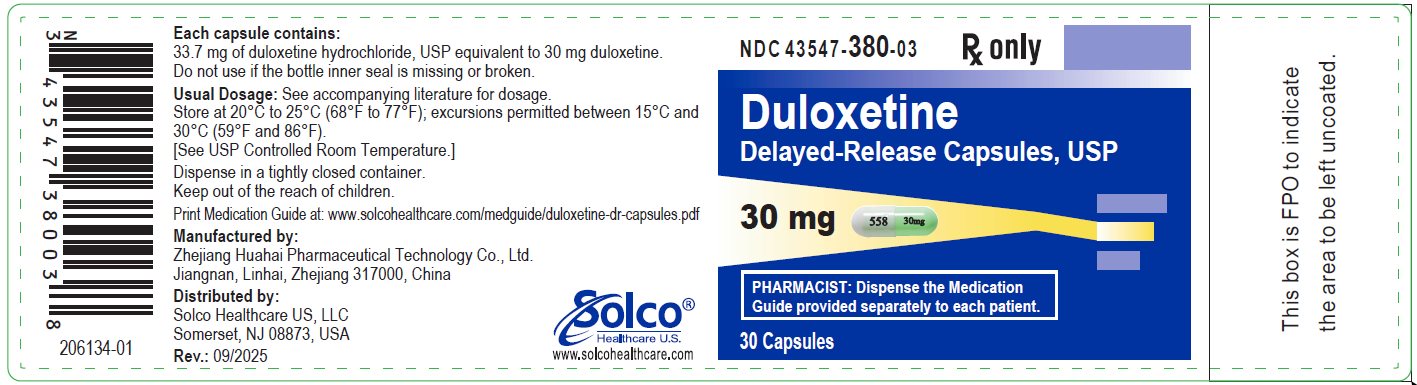
Duloxetine 30 mg delayed-release capsules label from Solco Healthcare US, LLC. The label includes dosage form and strength details, NDC 43547-380-03, storage instructions, manufacturer Zhejiang Huahai Pharmaceutical Technology Co., Ltd., and a visual of the capsule marked with 558 and 30mg. The package contains 30 capsules and advises pharmacists to dispense the medication guide separately.*
FDA Label Image

60mg-zht (Image 13)

60mg-zht (Image 13)
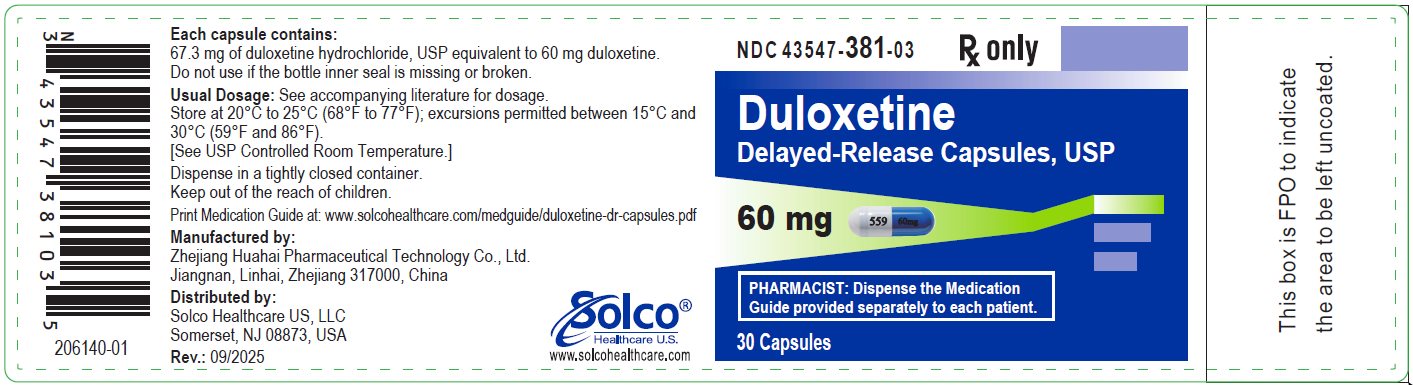
Label for Duloxetine Delayed-Release Capsules, USP 60 mg by Solco Healthcare US, LLC. The label includes the NDC 43547-381-03, a capsule image marked 559 and 60mg, storage instructions, manufacturer details in China, and a 30-capsule count. It advises pharmacists to dispense the Medication Guide separately.*

* About these descriptions: Image descriptions on this page are generated by automated AI analysis of the product label images from the manufacturer's FDA label submission (SPL). They are provided for reference only and may contain errors or omissions. Always rely on the printed label itself and the official FDA labeling, and consult a pharmacist or healthcare professional with any questions about this product.