Pemetrexed Injection, Powder, For Solution
Product Images NDC 43547-632

View Photos of Packaging, Regulatory Labels, and Product Appearance

Product Visual Gallery

This gallery contains 12 technical images submitted to the FDA as part of the official labeling for Pemetrexed (NDC 43547-632). Unlike standard consumer photos, these assets often include clinical data figures, molecular chemical structures, and official manufacturer packaging layouts.

As provided by Solco Healthcare Us, Llc, these visuals offer a comprehensive scientific overview of the product's physical and chemical identity, aiding pharmacists and researchers in product verification and study.

FDA Label Image

Figure 1 (Figure 1)

Figure 1 (Figure 1)
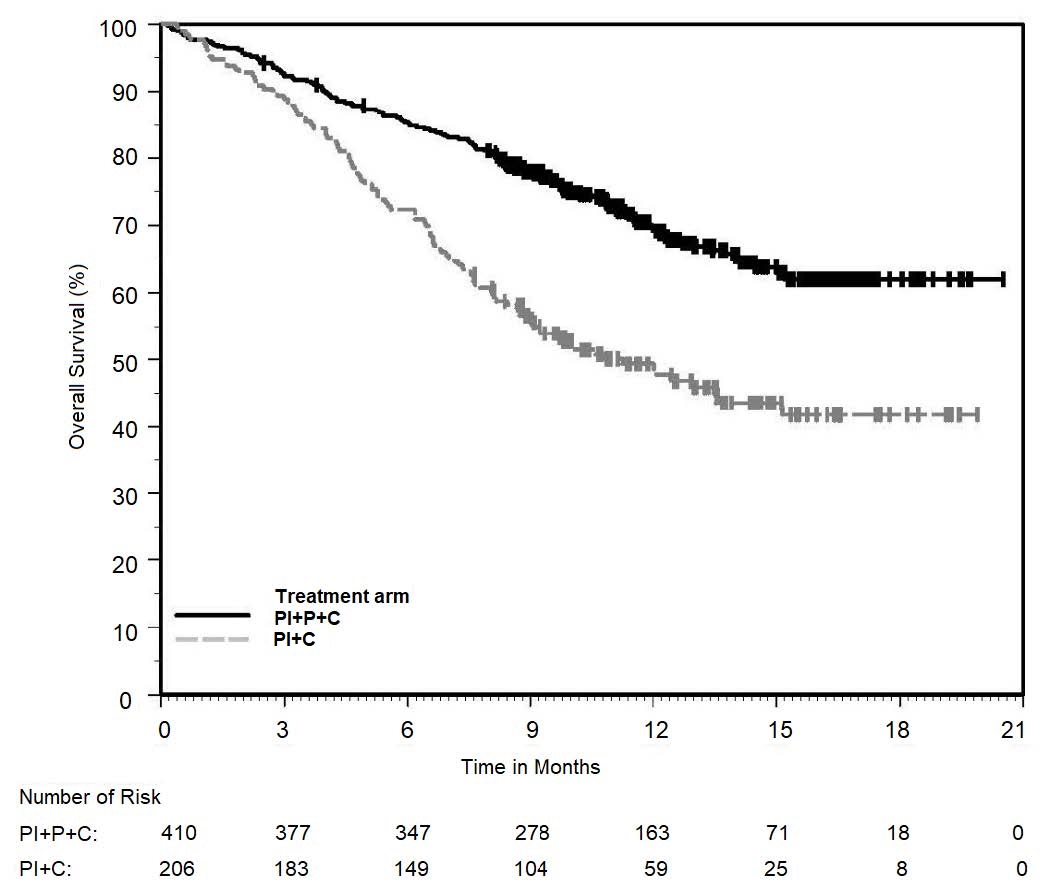
This is a chart showing the overall survival (%) over time in months for two different treatment arms. The first treatment arm is PI+P+C, with a total of 410 patients at the start and reaching 0 at 21 months. The second treatment arm is PI+C, which starts with 206 patients and also reaches 0 at 21 months. It provides insights into the effectiveness of the treatments in terms of overall survival rates.*
FDA Label Image

Figure 2 (Figure 2)

Figure 2 (Figure 2)
The data provided shows the survival probability over 30 months for two different treatment groups: Pemetrexed + Cisplatin (PC) and Gemcitabine + Cisplatin (GC). The number of patients at risk is given at different time intervals up to 30 months for each treatment group. This information can be used to analyze and compare the survival outcomes of the two treatments over time.*
FDA Label Image

Figure 5 (Figure 5)

Figure 5 (Figure 5)
This is a survival probability chart comparing the effectiveness of Pemetrexed for injection versus a placebo over time in months. The chart displays survival time and the number of patients at risk in each group at different time points.*
FDA Label Image

Figure 8 (Figure 8)

Figure 8 (Figure 8)
This data table shows the survival time in months for patients receiving Pemetrexed for injection and Placebo. The graph illustrates how many patients were still at risk over the course of 36 months, with the number of patients at risk decreasing over time for both treatment groups. This information can be helpful in evaluating the efficacy of Pemetrexed compared to Placebo on patient survival rates.*
FDA Label Image

Carton Label (Carton.png)

FDA Label Image

Container Label (Image 01)

Container Label (Image 01)
The text provides information about a pemetrexed disodium injection contained in a vial. Each vial contains 100 mg of pemetrexed and 106 mg of mannitol. The storage instructions recommend storing the vial between 20°C to 25°C and permit excursions between 15°C to 30°C. pH adjustment may have been done using hydrochloric acid and/or sodium hydroxide. For more details, the accompanying literature should be referred to, including information on storage of reconstituted and infusion solutions. The product is for intravenous use only and is made in China, distributed by Solco Healthcare in the USA. A patient information sheet can be found on www.solcohealthcare.com/druglabeling/pemetrexed-injection.pdf.*
FDA Label Image

Structural Formula (Image 02)

FDA Label Image

Figure 10 (Image 03)

Figure 10 (Image 03)
This text provides data on the survival probability of patients receiving treatment with Pemetrexed disodium and Cisplatin (PC). The table shows survival time in months and the number of patients at risk at various time points during the study. The survival times range from 2 to 84 months, with corresponding numbers of patients at risk decreasing over time.*
FDA Label Image

Figure 3 (Image 05)

Figure 3 (Image 05)
This data shows the survival probability for patients treated with Pemetrexed + Cisplatin (PC) versus Gemcitabine + Cisplatin (GC) over a period of 30 months. The table displays the number of patients at risk at different time points, highlighting the progression of survival over time for each treatment group. The information can be used to analyze and compare the effectiveness of the two treatment regimens in terms of patient survival.*
FDA Label Image

Figure 4 (Image 06)

FDA Label Image

Figure 6 (Image 08)

FDA Label Image

Figure 7 (Image 09)

Figure 7 (Image 09)
This information provides survival probability data for patients receiving Pemetrexed for injection compared to a placebo over different time intervals in months. The table also includes the number of patients at risk at each interval. The study tracked the survival time of patients over a 27-month period.*

* These product label images have been analyzed using experimental machine learning. Please verify findings with the primary label text.