Tadalafil Tablet
Product Images NDC 43547-990

View Photos of Packaging, Regulatory Labels, and Product Appearance

Product Visual Gallery

This gallery contains 8 technical images submitted to the FDA as part of the official labeling for Tadalafil (NDC 43547-990). Unlike standard consumer photos, these assets often include clinical data figures, molecular chemical structures, and official manufacturer packaging layouts.

As provided by Solco Healthcare Us, Llc, these visuals offer a comprehensive scientific overview of the product's physical and chemical identity, aiding pharmacists and researchers in product verification and study.

FDA Label Image

Ab0f57c0-figure-01 (Ab0f57c0 Figure 01)

Ab0f57c0-figure-01 (Ab0f57c0 Figure 01)
Chemical structure diagram of the active ingredient tadalafil, showing its molecular framework with labeled atoms and bonds in a two-dimensional format.*
FDA Label Image

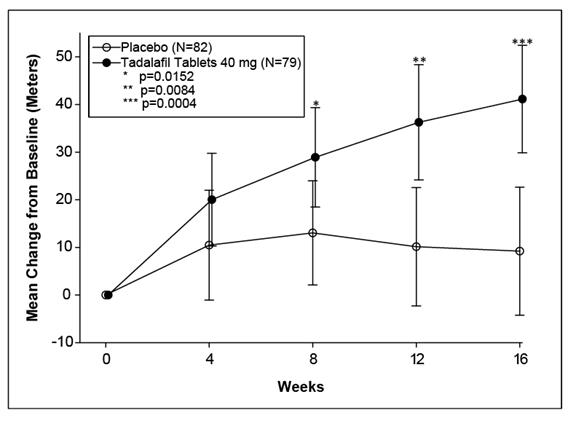
Ab0f57c0-figure-02 (Ab0f57c0 Figure 02)

Ab0f57c0-figure-02 (Ab0f57c0 Figure 02)
A line graph comparing mean change from baseline in meters over 16 weeks for Tadalafil Tablets 40 mg and placebo groups. The graph plots weeks on the x-axis and mean change on the y-axis, showing increased mean change with Tadalafil over time relative to placebo, with statistical significance indicated at 8, 12, and 16 weeks.*
FDA Label Image

Ab0f57c0-figure-03 (Ab0f57c0 Figure 03)

Ab0f57c0-figure-03 (Ab0f57c0 Figure 03)
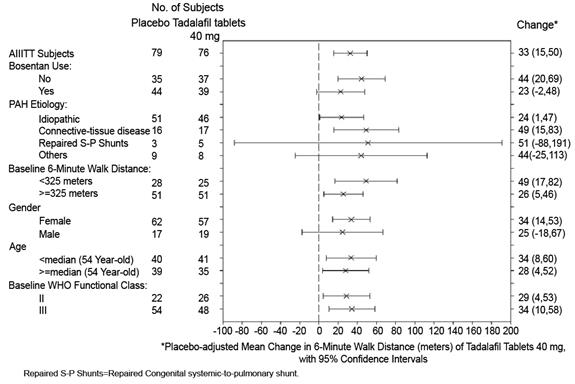
A horizontal bar chart showing placebo-adjusted mean changes in 6-minute walk distance (meters) for subjects treated with Tadalafil 40 mg versus placebo. The chart compares subgroups by bosentan use, PAH etiology, baseline walk distance, gender, age, and baseline WHO functional class, with 95% confidence intervals indicated for each subgroup.*
FDA Label Image

Ab0f57c0-figure-04 (Ab0f57c0 Figure 04)

Ab0f57c0-figure-04 (Ab0f57c0 Figure 04)
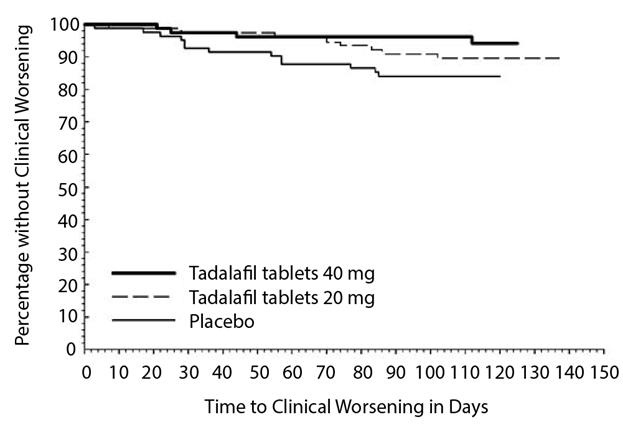
A line graph depicting the percentage without clinical worsening of patients over time in days. The graph compares three groups: tadalafil tablets 40 mg (solid thick line), tadalafil tablets 20 mg (dashed line), and placebo (solid thin line), showing their progression over approximately 150 days.*
FDA Label Image

20mg 60 Tablets (Ab0f57c0 Figure 05)

20mg 60 Tablets (Ab0f57c0 Figure 05)
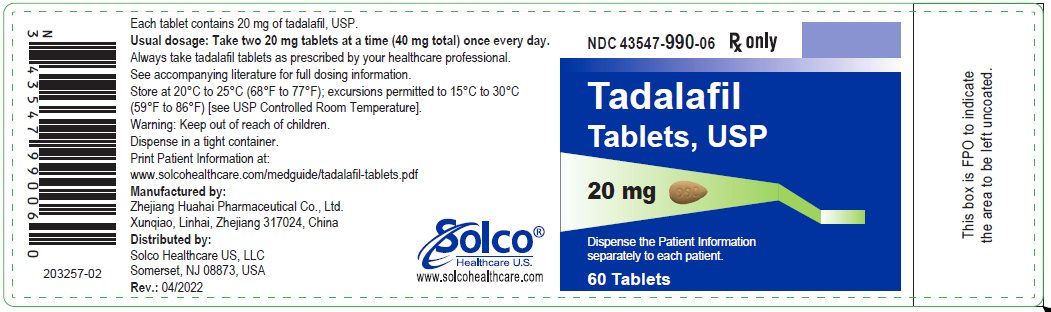
Label for Tadalafil Tablets, USP 20 mg oral tablets by Solco Healthcare US, LLC. The label includes dosage instructions, storage conditions, manufacturer (Zhejiang Huahai Pharmaceutical Co., Ltd., China), and distributor information. The package contains 60 tablets and features a blue background with a green arrow graphic.*
FDA Label Image

Figure 1 (Image 01)

Figure 1 (Image 01)
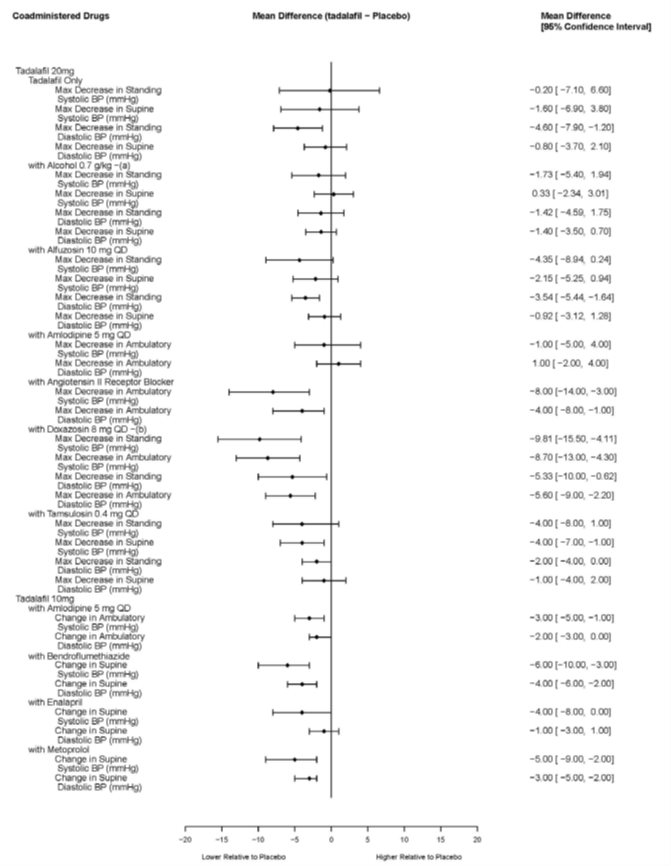
A forest plot chart depicting the mean difference in blood pressure measurements between tadalafil and placebo across various conditions and coadministered drugs. The chart presents mean differences with 95% confidence intervals for systolic and diastolic blood pressure changes or decreases in standing, supine, and ambulatory settings for tadalafil 20 mg and 10 mg doses combined with several medications such as alcohol, alfuzosin, amlodipine, angiotensin II receptor blockers, doxazosin, tamsulosin, bendroflumethiazide, enalapril, and metoprolol.*
FDA Label Image

Figure 2 (Image 02)

Figure 2 (Image 02)
A forest plot chart depicting the fold change and 90% confidence intervals for the pharmacokinetic parameters AUC and Cmax of tadalafil when coadministered with various drugs, including CYP3A inhibitors (ritonavir, ketoconazole), CYP3A inducers (rifampin, bosentan), antacids, and H2 antagonists (nizatidine). The chart also lists dosage recommendations such as dose adjustment, avoid use, or no dose adjustment for each coadministered drug relative to tadalafil alone.*
FDA Label Image

Figure3 (Image 03)

Figure3 (Image 03)
A forest plot illustrating fold changes and 90% confidence intervals for area under the curve (AUC) and maximum concentration (Cmax) of various coadministered drugs with tadalafil. It includes CYP1A2, CYP2C9, CYP3A substrates, P-glycoprotein substrates, oral contraceptives, and NSAIDs, showing no required dose adjustments for any listed drug interactions based on the plotted changes relative to the coadministered drug alone.*

* About these descriptions: Image descriptions on this page are generated by automated AI analysis of the product label images from the manufacturer's FDA label submission (SPL). They are provided for reference only and may contain errors or omissions. Always rely on the printed label itself and the official FDA labeling, and consult a pharmacist or healthcare professional with any questions about this product.