Fulvestrant Injection, Solution
Product Images NDC 43598-262

18 FDA label images from Dr.reddy's Laboratories Inc · Packaging, Regulatory Labels, and Product Appearance

Product Visual Gallery

This gallery contains 18 technical images submitted to the FDA as part of the official labeling for Fulvestrant (NDC 43598-262). Unlike standard consumer photos, these assets often include clinical data figures, molecular chemical structures, and official manufacturer packaging layouts.

As provided by Dr.reddy's Laboratories Inc, these visuals offer a comprehensive scientific overview of the product's physical and chemical identity, aiding pharmacists and researchers in product verification and study.

FDA Label Image

Figure10 (Figure10)

Figure10 (Figure10)
A Kaplan-Meier survival curve chart illustrating overall survival probability (%) over time in months for two groups: Fulvestrant plus palbociclib and Fulvestrant plus placebo. The x-axis represents time from 0 to about 54 months, and the y-axis shows overall survival probability from 0 to 100%. The chart includes a legend differentiating the two treatment groups and a table showing the number of patients at risk at various time points for each group.*
FDA Label Image

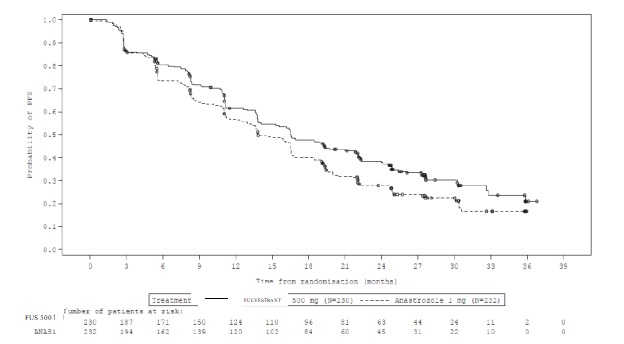
Figure8

Figure8
A Kaplan-Meier survival curve graph displaying the probability of progression-free survival (PFS) over time in months from randomization. The graph compares two treatments, Fulvestrant 500 mg and Anastrozole 1 mg, with corresponding patient numbers at risk listed below the x-axis.*
FDA Label Image

Carton (Carton)

Carton (Carton)
Packaging label for Fulvestrant Injection 250 mg/5 mL (50 mg/mL) in single-dose prefilled syringes. The carton contains two syringes totaling 500 mg fulvestrant for intramuscular use. Distributed by Dr. Reddy's Laboratories Inc., Princeton, NJ, made in India. Storage instructions specify refrigeration and protection from light.*
FDA Label Image

Figure1 (Figure1)

Figure1 (Figure1)
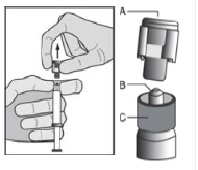
An instructional diagram illustrating the process of injecting from a vial. It shows a hand holding a syringe drawing fluid from a vial and detailed callouts of vial components labeled A, B, and C. The first section includes a warning symbol for improper handling, advising against shaking or incorrect syringing technique.*
FDA Label Image

Figure2 (Figure2)

Figure2 (Figure2)
Instructional illustration showing how to prepare Fulvestrant 50 mg/mL injection solution for intramuscular use. It demonstrates drawing medication with a syringe from the vial. Additional detailed views of the vial top and cap components are labeled A, B, and C.*
FDA Label Image

Figure4 (Figure4)

Figure4 (Figure4)
A Kaplan-Meier survival curve titled 'Progression Free Survival (ITT Population)' comparing the proportion of patients who remain progression free over time (months) for Fulvestrant 250 mg and 500 mg doses. The graph includes a time axis from 0 to 45 months and a vertical axis showing the proportion of patients progression free. Below the graph, the number of patients at risk for each dose group is listed at various time points.*
FDA Label Image

Figure5 (Figure5)

Figure5 (Figure5)
A survival curve chart comparing the proportion of patients alive over time in months for Fulvestrant 500 mg and 250 mg doses. The chart includes tick marks indicating censored observations and a table showing the number of patients at risk at various time points for each dose. The legend identifies the two dose groups.*
FDA Label Image

Figure9 (Figure9)

Figure9 (Figure9)
A Kaplan-Meier survival curve comparing progression-free survival probability (%) over time (months) between two groups: Fulvestrant with palbociclib (solid line) and Fulvestrant with placebo (dashed line). The graph includes a patient risk table for each group at various time points up to 14 months, showing higher survival probability for the Fulvestrant plus palbociclib group throughout the study period.*
FDA Label Image

Graph11

Graph11
A Kaplan-Meier curve showing progression-free survival probability (%) over time (months) for two groups: Fulvestrant plus Abemaciclib (N=446) and Fulvestrant plus Placebo (N=223). The graph includes censored observations and a table listing the number of patients at risk at multiple time points for each group.*
FDA Label Image

Graph12

Graph12
Kaplan-Meier survival probability graph comparing Fulvestrant plus Abemaciclib versus Fulvestrant plus Placebo over time in months. The y-axis shows survival probability percentage, and the x-axis indicates time up to 57 months. The graph includes censored observations and a table of patient risk counts for both treatment groups across time points.*
FDA Label Image

Graph13

Graph13
A Kaplan-Meier survival curve chart showing event-free probability over 26 months comparing two groups: Fulvestrant plus Ribociclib (N=484) and Fulvestrant plus placebo (N=242). The chart includes censoring times and a table of the number of patients at risk at various time points.*
FDA Label Image

Graph14

Graph14
A Kaplan-Meier survival curve graph showing event-free probability (%) over time in months for Fulvestrant with Ribociclib versus Fulvestrant with Placebo. The chart includes censoring times and patient numbers at risk at various months, with both groups decreasing in event-free probability over 48 months.*
FDA Label Image

Pfs (Pfs)

Pfs (Pfs)
Label for Fulvestrant Injection 250 mg/5 mL (50 mg/mL) solution for intramuscular injection by Dr.Reddy's Laboratories Inc. The label includes dosage strength, administration instructions, barcode, lot and expiration date fields, and a warning to protect from light. The label is a two-layer design with specified dimensions and sharp-cut edges.*
FDA Label Image

Step1 (Step1)

Step1 (Step1)
Instructional diagram showing a person holding a syringe by the plunger with one hand and the barrel with the other hand, demonstrating a step in preparing the syringe for injection. This appears to be part of a step-by-step guide for administering an intramuscular injection.*
FDA Label Image

Step2 (Step2)

Step2 (Step2)
An instructional diagram showing Step 2 of preparing an injection. It illustrates removing a needle cap from a syringe and positioning the syringe for use, with a close-up inset highlighting the needle tip.*
FDA Label Image

Step3 (Step3)

Step3 (Step3)
An instructional illustration showing three methods of activation for an injection device labeled as Step 3. The methods are Finger Activation, Thumb Activation, and Surface Activation, each depicted with a hand demonstrating the specific technique to activate the device prior to injection.*
FDA Label Image

Step4 (Step4)

Step4 (Step4)
An instructional diagram labeled Step 4 showing the assembly or confirmation of a safety lock mechanism on a syringe or injection device. The illustration highlights the connection points between the needle, safety lock, and vial or container.*
FDA Label Image

Structure (Structure)

Structure (Structure)
Chemical structure of fulvestrant, showing its molecular composition with hydroxyl groups, a steroid backbone, and a fluorinated sulfonyl side chain.*

* About these descriptions: Image descriptions on this page are generated by automated AI analysis of the product label images from the manufacturer's FDA label submission (SPL). They are provided for reference only and may contain errors or omissions. Always rely on the printed label itself and the official FDA labeling, and consult a pharmacist or healthcare professional with any questions about this product.