Azacitidine Injection, Powder, Lyophilized, For Solution
Product Images NDC 43598-465

View Photos of Packaging, Regulatory Labels, and Product Appearance

Product Visual Gallery

This gallery contains 4 technical images submitted to the FDA as part of the official labeling for Azacitidine (NDC 43598-465). Unlike standard consumer photos, these assets often include clinical data figures, molecular chemical structures, and official manufacturer packaging layouts.

As provided by Dr. Reddy's Laboratories Inc., these visuals offer a comprehensive scientific overview of the product's physical and chemical identity, aiding pharmacists and researchers in product verification and study.

FDA Label Image

Carton (Carton)

Carton (Carton)
This is a product label for Azacitidine, a lyophilized powder for injection. Each vial contains 100mg of the drug and is meant for a single use only. The recommended dosage should be prescribed by a healthcare professional and administered via injection. The label includes instructions on storage and contact information for the manufacturer.*
FDA Label Image

Vial (Vial)

FDA Label Image

Graph (Graph)

Graph (Graph)
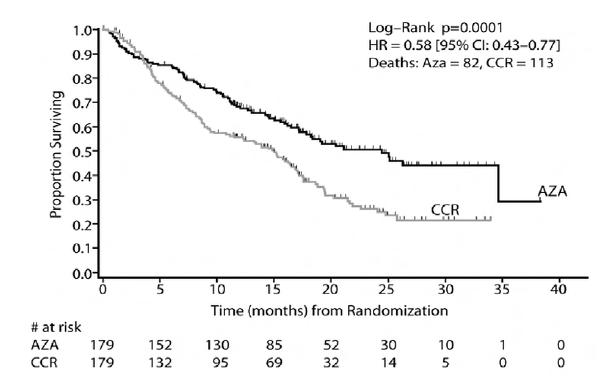
This is the result of a statistical analysis comparing two treatments (AZA and CCR) in terms of their effect on patient survival. The Log-Rank statistical test was used, and the result is highly significant (p=00001) indicating that the survival curves for both treatments are different. The Hazard Ratio (HR) is also reported, which measures the relative risk of death between groups. The HR is 0.58 indicating that patients in the AZA group had a lower risk of death compared to the CCR group. The confidence interval (95% C1) for the HR is [0.43-0.77), which means the true value of the HR is likely to fall within this range with 95% certainty. The number of deaths observed in each group is also reported (Aza = 82, CCR = 113). Finally, the survival curves for both treatments are shown graphically, with the proportion of patients surviving over time (in months) plotted on the y-axis and time (in months) since randomization plotted on the x-axis. The number of patients "at risk" at each time point is also shown for each treatment group.*
FDA Label Image

Structure (Structure)

* These product label images have been analyzed using experimental machine learning. Please verify findings with the primary label text.