Levetiracetam Injection
Product Images NDC 43598-635

View Photos of Packaging, Regulatory Labels, and Product Appearance

Product Visual Gallery

This gallery contains 8 technical images submitted to the FDA as part of the official labeling for Levetiracetam (NDC 43598-635). Unlike standard consumer photos, these assets often include clinical data figures, molecular chemical structures, and official manufacturer packaging layouts.

As provided by Dr.reddy's Laboratories Inc, these visuals offer a comprehensive scientific overview of the product's physical and chemical identity, aiding pharmacists and researchers in product verification and study.

FDA Label Image

1000carton (1000carton)

1000carton (1000carton)
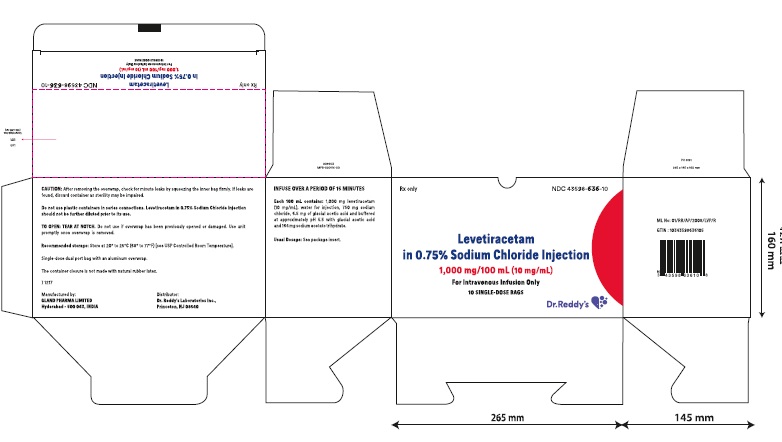
Levetiracetam is available in 0.75% Sodium Chloride Injection with a concentration of 1,000 mg/100 mL (1 m/mt). The rest of the text is not available or readable.*
FDA Label Image

1500 Carton (1500 Carton)

1500 Carton (1500 Carton)
Levetiracetam is a medication that is injected into 0.54% sodium chloride solution at a concentration of 1500mg/100L (18 mrm). Unfortunately, without additional information, the purpose or specific use of this medication cannot be determined.*
FDA Label Image

500carton (500carton)

500carton (500carton)
Levetiracetam is a medication that comes in the form of an injection mixed with 0.82% sodium chloride. Each injection contains 500 mg of the medication per 100 L. There is also a logo present on the packaging which reads "OrRoddys." The dimensions of the packaging are 265mm by 145mm.*
FDA Label Image

Figure1 (Figure1)

Figure1 (Figure1)
This is a chart showing the percentage of patients taking either a placebo or different doses of levetiracetam for a study. There were 95 patients taking the placebo, 97 taking 1000mg/day of levetiracetam, and 101 taking 3000mg/day of levetiracetam. The chart shows that 39.6% of patients taking the lower dose of levetiracetam experienced some benefit, while 37.1% of patients taking the higher dose experienced a benefit. 7.4% of patients taking the placebo experienced a benefit.*
FDA Label Image

Figure2 (Figure2)

Figure2 (Figure2)
This appears to be a chart showing various percentages related to a study comparing a placebo to two different doses of levetiracetam (at 1000mg/day and 2000mg/day). The percentages listed may indicate the success rates or side effects associated with each treatment option. However, without more context or explanation, it is difficult to determine exactly what the percentages represent or how they were measured.*
FDA Label Image

Figure3 (Figure3)

Figure3 (Figure3)
This appears to be a chart showing the percentage of patients who had a certain outcome or reaction to either a placebo (104 patients) or a medication called Levetiracetam (180 patients taking 3000 mg/day). The outcomes are not described and the chart includes some blank spaces.*
FDA Label Image

Figure4 (Figure4)

Figure4 (Figure4)
This text appears to be a table representing different percentages for two groups of data named "Placebo" (with 84 elements) and "Levetiracetam" (with 79 elements). The variable corresponding to these percentages is not mentioned, so it is not possible to determine what this table represents.*
FDA Label Image

Structure (Structure)

* These product label images have been analyzed using experimental machine learning. Please verify findings with the primary label text.