Prednisone Delayed Release Tablet, Delayed Release
Product Images NDC 43598-886

View Photos of Packaging, Regulatory Labels, and Product Appearance

Product Visual Gallery

This gallery contains 6 technical images submitted to the FDA as part of the official labeling for Prednisone Delayed Release (NDC 43598-886). Unlike standard consumer photos, these assets often include clinical data figures, molecular chemical structures, and official manufacturer packaging layouts.

As provided by Dr. Reddys Laboratories Inc., these visuals offer a comprehensive scientific overview of the product's physical and chemical identity, aiding pharmacists and researchers in product verification and study.

FDA Label Image

Carton1mg (Carton1mg)
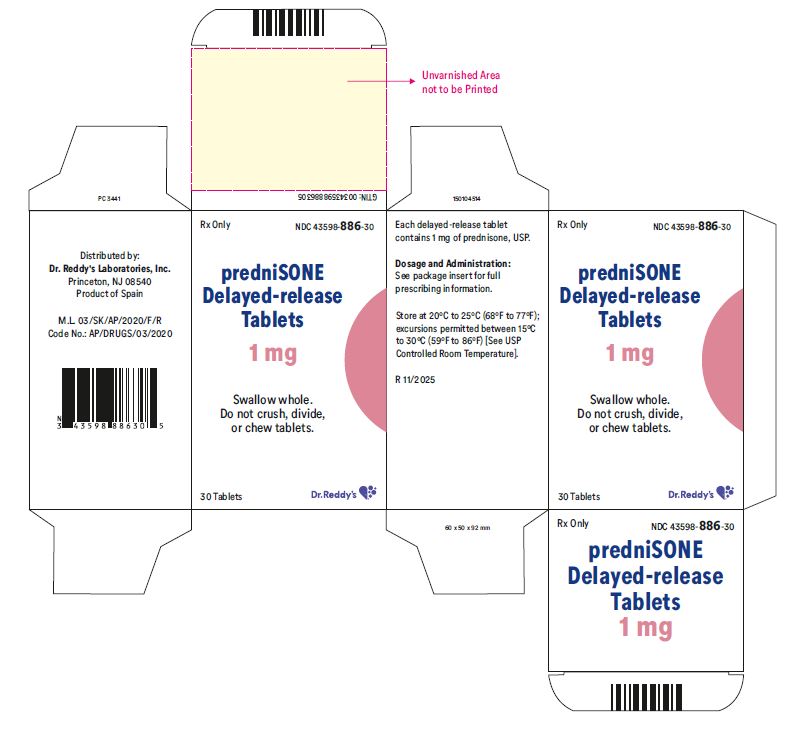
Carton1mg (Carton1mg)
Packaging label for predniSONE delayed-release tablets 1 mg by Dr. Reddys Laboratories Inc. The label indicates the tablets are oral, delayed-release, with a quantity of 30 tablets per package. It includes dosage instructions to swallow whole without crushing, dividing, or chewing. The label also shows storage instructions and manufacturer details.*
FDA Label Image

Carton2mg (Carton2mg)

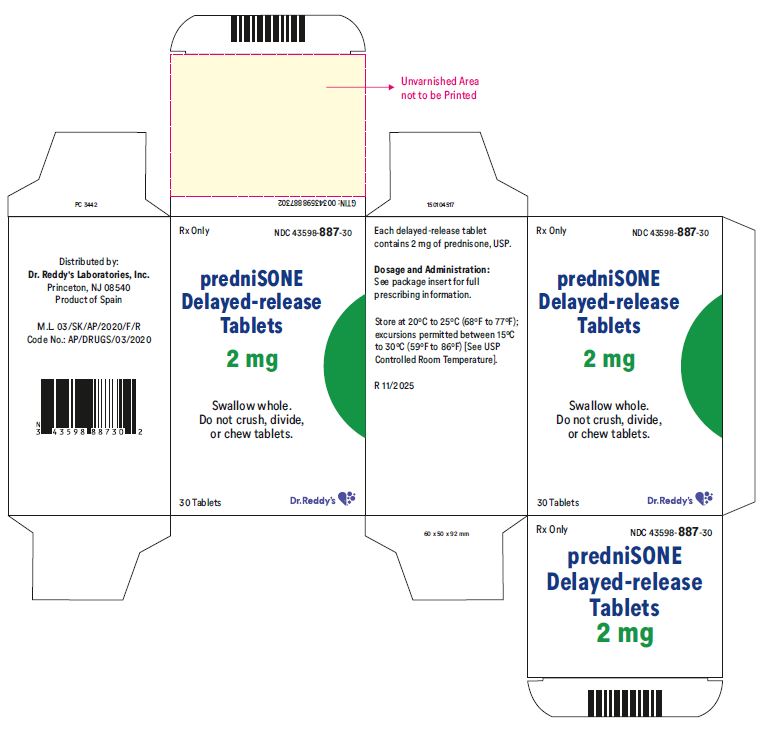
Carton2mg (Carton2mg)
Packaging label for Prednisone delayed-release Tablets 2 mg by Dr. Reddys Laboratories Inc. The label includes the dosage strength, tablet use instructions (swallow whole, do not crush, divide, or chew), storage conditions, and NDC number 43598-887-30. The package contains 30 tablets and is marked Rx only.*
FDA Label Image

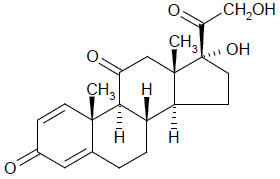
Chemical-structure (Chemical Structure)

Chemical-structure (Chemical Structure)
Chemical structure diagram of prednisone, the active ingredient in prednisone delayed release tablets by Dr. Reddys Laboratories Inc. The structure shows a four-ring steroid backbone with attached oxygen and hydroxyl groups.*
FDA Label Image

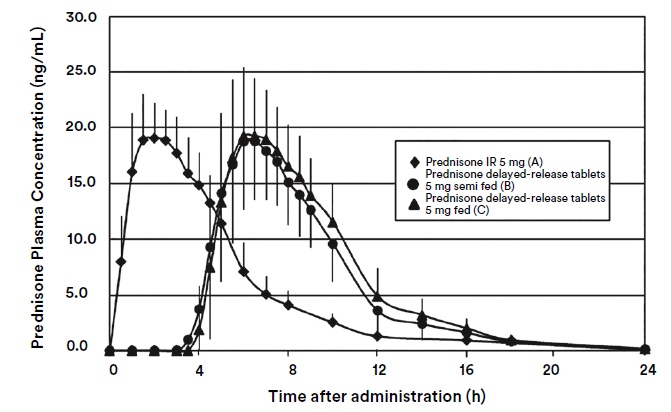
Figure1 (Figure1)

Figure1 (Figure1)
A line graph depicting prednisone plasma concentration (ng/mL) over 24 hours after administration. It compares immediate-release prednisone 5 mg and delayed-release prednisone 5 mg tablets under semi-fed and fed conditions, showing time versus plasma levels with error bars.*
FDA Label Image

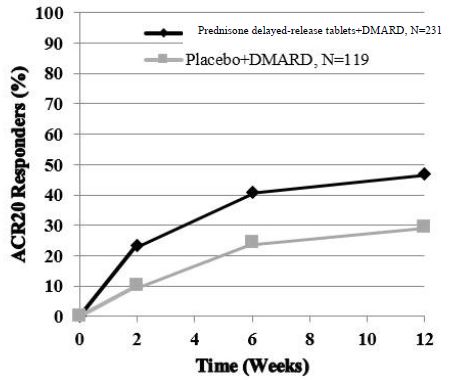
Figure2 (Figure2)

Figure2 (Figure2)
A line graph showing the percentage of ACR20 responders over time (weeks) comparing Prednisone delayed-release tablets plus DMARD (N=231) with Placebo plus DMARD (N=119). The graph shows greater responder percentages with Prednisone delayed-release treatment across 12 weeks.*
FDA Label Image

Logo-drl (Logo Drl)

* About these descriptions: Image descriptions on this page are generated by automated AI analysis of the product label images from the manufacturer's FDA label submission (SPL). They are provided for reference only and may contain errors or omissions. Always rely on the printed label itself and the official FDA labeling, and consult a pharmacist or healthcare professional with any questions about this product.