Figure-1 (Image 01)
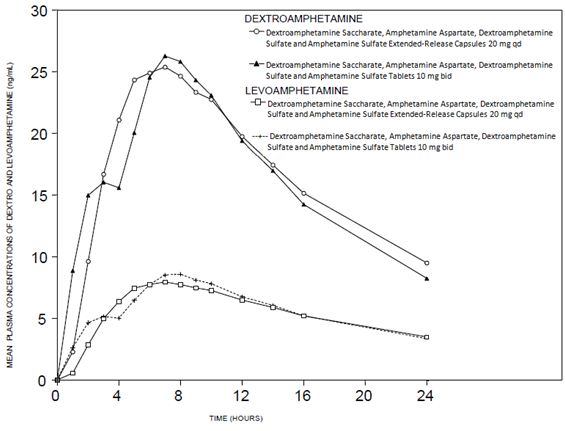
MEAN PLASMA CONCENTRATIONS OF DEXTRO AND LEVOAMPHETAMINE (ngint) are shown in a graph with the X-axis representing the time in hours and the Y-axis representing the concentration of the amphetamines in the plasma in ngint. The graph shows different mean plasma concentrations of Dextroamphetamine and Levoamphetamine over a 24 hour period. Specific brand names and chemical formulations of the drugs are also mentioned.*